What Is a Thread Dump and How to Analyze It?
A Java thread dump captures thread states and stack traces at one moment. Learn to take one, read it systematically, and know when you need more evidence.
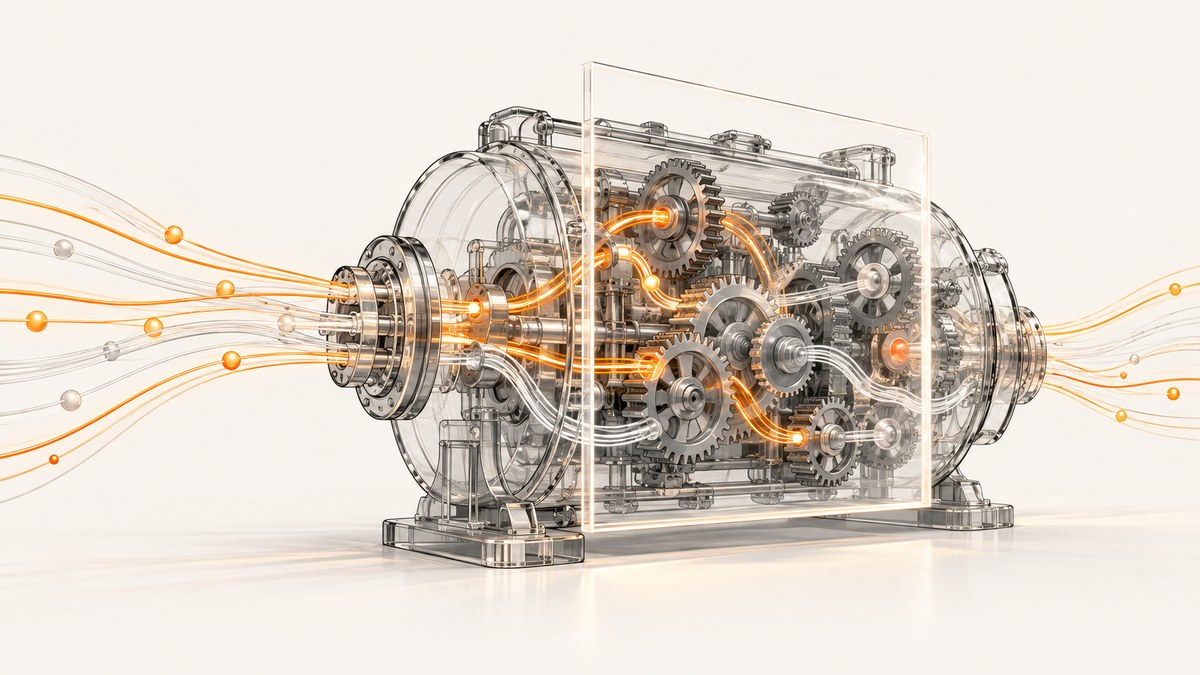
A Java thread dump is a point-in-time view of the threads running in a JVM, usually including each thread’s name, state, and stack trace. It helps you investigate hangs, lock contention, and unusual thread activity by showing what threads were doing at capture time. It does not provide a timeline: take multiple dumps during the symptom, compare their states and stacks, and check lock ownership before concluding that a thread is stuck or deadlocked.
On a compatible JVM, run jcmd <pid> Thread.print on the same machine as the process, using the same effective user and group identifiers that launched it. Add -l when supported to include java.util.concurrent lock information. Command availability and options vary by JVM, so check the target process’s command help first. [Oracle jcmd reference] [Oracle diagnostic tools guide]
1. What a thread dump tells you
A thread dump records a snapshot, not a recording of everything that happened before or after it. For each thread, it can show a name, a state, stack frames, and—depending on the command and JVM—information about locks and their owners. Stack frames identify code paths the thread had reached; the state describes its interaction with the JVM at the time the dump was requested.
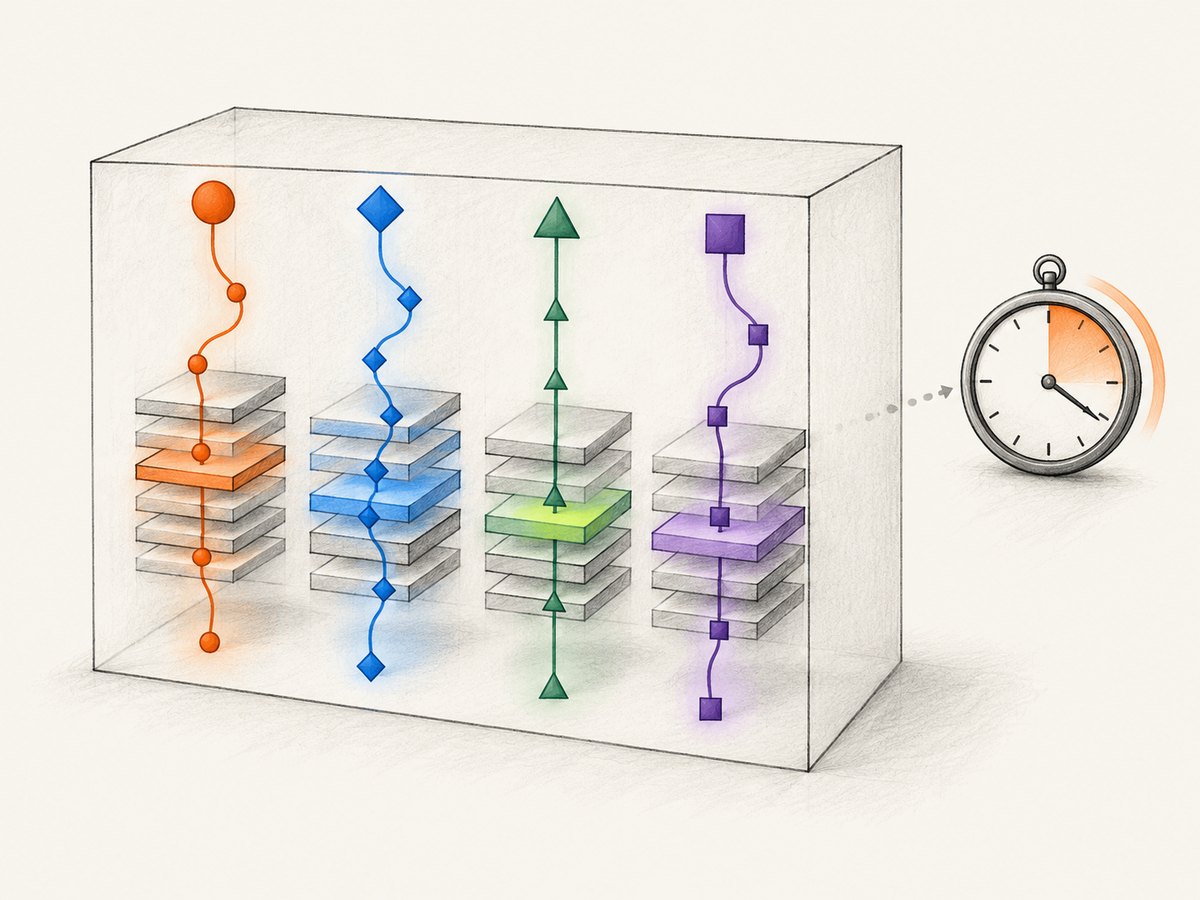
That makes a dump useful when an application appears unresponsive, requests are slowing down, or many threads seem to be waiting. It can help narrow the investigation to a shared lock, repeated application frames, or a pool whose threads are occupied. A single dump rarely proves the root cause. Capture a few while the problem is occurring so you can distinguish a persistent pattern from ordinary waiting or work that is making progress.
A thread dump is not a heap dump. A heap dump describes objects and references in memory; a thread dump focuses on threads, stacks, and available synchronization details. Nor is it a time profile: it cannot by itself show how long a thread spent in a particular frame or what occurred between captures.
2. Capture a thread dump with jcmd
Find the target JVM
Run the diagnostic command from the machine hosting the JVM and, as Oracle specifies, with the same effective user and group identifiers as the JVM process. Identify the correct PID before capturing. If several Java processes are present, an incorrect PID can yield a dump for a different application or an attach error.
Check the target JVM’s options
Ask the running JVM which Thread.print options it supports:
jcmd <pid> help Thread.printThe available diagnostic commands depend on the JVM. Oracle’s Java 21 guide documents -l to include java.util.concurrent locks and -e for extended thread information. Confirm support on your actual target rather than assuming that every vendor and release exposes identical flags.
Print and save the dump
Basic capture:
jcmd <pid> Thread.printCapture with lock information when the target supports it:
jcmd <pid> Thread.print -lRedirect output to a file so it can be compared with later captures. The following shell examples print the dump and write it to a timestamped file:
# POSIX shell: basic dump
jcmd <pid> Thread.print > thread-dump-1.txt

# POSIX shell: include java.util.concurrent locks, if supported
jcmd <pid> Thread.print -l > thread-dump-2.txt
Run the commands separately during the symptom, leaving enough time between snapshots to see whether the stacks or lock relationships change. Keep the files secure: stacks can expose class names, internal endpoints, or other operational details. Avoid posting unreviewed dumps publicly.
Know what the flags do
| Command or flag | Purpose | Notes |
|---|---|---|
Thread.print |
Prints thread stacks for the target JVM. | Supported command set depends on the JVM. |
-l |
Includes java.util.concurrent lock information on documented targets. |
Check target help before relying on it. |
-e |
Requests extended thread information on documented targets. | Exact output and support can vary. |
These options are not interchangeable. Use the basic command for a stack snapshot; request lock or extended information when it helps answer a specific question and the target supports it. The jcmd reference documents the diagnostic command syntax, while the target JVM’s own help is the practical check for that process. [Oracle jcmd reference]
3. Analyze the dump in a repeatable order
- Start with the symptom and capture time. Note when users observed the hang or slowdown and whether it was still occurring. A dump taken after recovery may show normal activity rather than the incident.
- Group threads by name and role. Look for repeated names that suggest worker pools, request handlers, schedulers, or other groups. Thread names are clues; verify their role from the application and stack frames.
- Read states together with stacks. Find large groups of threads in the same state, then inspect where each is waiting or executing. A state label alone does not tell you whether the application is unhealthy.
- Follow lock ownership. If a thread is waiting for a monitor or other reported lock, identify the owner where available and inspect the owner’s stack. Determine whether the owner is progressing, waiting on another dependency, or part of a cycle.
- Compare additional snapshots. Check whether the same threads remain in the same stacks and lock relationships or whether they move. Persistent repetition is evidence of a possible bottleneck, but it still needs to be interpreted against the symptom and application behavior.
Interpret thread states carefully
| State | Meaning | What to inspect |
|---|---|---|
RUNNABLE |
Executing in the JVM. | Read the stack to understand the work. This label does not guarantee high CPU use. |
BLOCKED |
Waiting to acquire a monitor lock. | Find the awaited lock and its owner if available. |
WAITING |
Waiting indefinitely for another thread to perform an action. | Identify the awaited condition and whether a producer or owner can make progress. |
TIMED_WAITING |
Waiting for another thread to act within a specified time. | Check the stack and repeat captures; timed waiting can be normal. |
NEW / TERMINATED |
Not yet started / exited. | Interpret in context; these states alone are not a hang diagnosis. |
These state descriptions follow Oracle’s troubleshooting documentation. [Oracle Java troubleshooting guide]
4. Distinguish deadlock from ordinary waiting
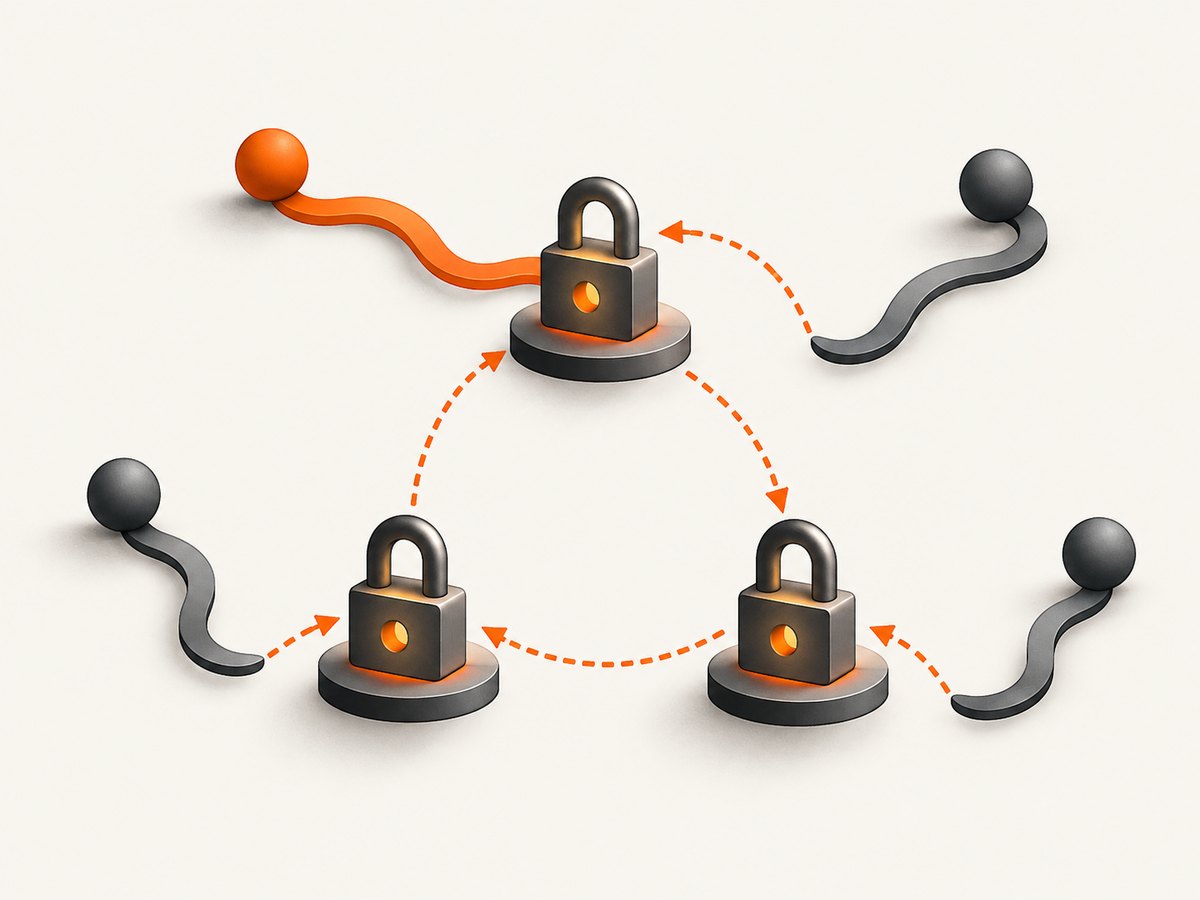
A deadlock involves a cycle of dependencies: one thread waits for a lock held by another, which in turn waits for a lock held by the first thread or another thread in the cycle. Finding a collection of waiting threads is not enough. Trace the locks and owners to establish the cycle.
Oracle documents deadlock detection through the Control+Break handler and describes output that identifies threads, locks, and owners. JConsole’s Threading MBean also provides monitor-deadlock detection; its thread information can include stack traces and monitor lock ownership. These can complement manual inspection when the dump format is hard to follow. [Oracle troubleshooting guide] [Oracle JConsole guide]
For apparent contention or pool starvation, look for repeated convergence on the same lock or application frames. Check whether the lock owner is itself progressing, and whether the pattern coincides with the reported slowdown. A blocked thread may be a consequence rather than the original cause; the owner’s stack can point toward the work or dependency holding up the group.
5. When to use JFR and JMC instead
Use thread dumps when you need a point-in-time view of stacks, states, and available lock relationships. If an issue is intermittent, needs a timeline, or is not explained by several snapshots, consider Java Flight Recorder (JFR) and Java Mission Control (JMC) as complementary tools.
JFR collects runtime profiling and event data, including thread samples and lock profiles. Oracle describes it as integrated into the JVM with very small performance overhead, while noting its use in production environments; that is not a promise of zero impact. JMC visualizes recordings with diagnostic tables, charts, and automated analysis. A recording can help investigate activity over time that a plain dump cannot show. [Oracle diagnostic tools guide]
Oracle documents jcmd commands for starting, checking, stopping, and dumping Flight Recorder sessions. Exact commands and options depend on the target release, so consult the JVM’s help and its release documentation. A JFR recording is a different diagnostic artifact from a thread dump: use the one that answers the question, or both when a snapshot points to a problem that needs a timeline.
6. Troubleshooting common capture and analysis problems
| Problem | Likely cause | What to do |
|---|---|---|
jcmd cannot attach |
Wrong PID, different effective user or group, process access restrictions, environment issue, or incompatible JVM. | Confirm the process and host, run with the JVM’s effective user and group, and check target compatibility and command availability. |
Thread.print is unknown |
The target JVM does not expose that diagnostic command or the command was issued against the wrong process. | Run jcmd <pid> help and verify the PID and JVM release. |
-l or -e is rejected |
The option is unavailable on that target or differs by vendor/release. | Run jcmd <pid> help Thread.print; use only documented options. |
| The dump contains many waiting threads | Waiting can be normal and does not establish a hang or deadlock. | Read stacks, identify awaited locks and owners, and compare snapshots taken during the symptom. |
| No obvious deadlock appears | The issue may be contention, a slow dependency, pool starvation, an intermittent event, or a cycle not evident in the inspected output. | Trace owner/waiter relationships; use more snapshots or JFR/JMC when a timeline is needed. |
| Snapshots disagree | The system may be progressing, the symptom may be intermittent, or capture times may differ from the incident. | Record timestamps and symptom context; collect snapshots while the issue is active. |
7. Reliability, performance, and operational notes
- Capture more than once when the incident allows. Repeated snapshots help reveal stable patterns, but they do not alone prove causation.
- Use the target’s own command help. JVM vendor and release affect available diagnostics and flags.
- Run with the required process identity.
jcmdattach depends on being on the same machine and using the same effective user and group identifiers as the target process. - Choose the right time-based tool. A dump gives a snapshot; JFR and JMC are suited to investigating event and profiling data over time.
- Protect diagnostic output. Review stacks before sharing them outside the team because they can reveal implementation details.
Do not interpret RUNNABLE as proof of CPU saturation, WAITING as proof of a hang, or the absence of a visible cycle as proof that no incident exists. A thread dump is evidence from one instant; correlate it with the symptom and other diagnostics.
8. Or skip the browser setup
Thread dumps are for JVM behavior. If your incident also involves checking what a user-facing page rendered, a screenshot can preserve the visible page state while you investigate the Java process. ScreenshotNeo is a website screenshot API and MCP server; its API accepts a URL and returns an image or PDF. See the ScreenshotNeo API documentation.
curl -G "https://api.screenshotneo.com/v1/shot" -d access_key=YOUR_API_KEY --data-urlencode url=https://stripe.com -o shot.webpCookie banners, newsletter popups, and chat widgets are removed before the shot. Bot checks, blank pages, timeouts, failed loads, and cache hits are not billed; response headers report the page verdict and billing status. An MCP server lets AI agents use screenshot tools. The Free plan includes 1,000 shots per month with no card; paid plans start at $5 for 3,000 shots. Start with 1,000 free screenshots a month, no card required.
FAQ
Does a thread dump stop the JVM?
A thread dump requests diagnostic output from a running JVM. The supplied sources do not describe it as stopping the JVM; use the target JVM’s documented diagnostic behavior and operational procedures.
Can I diagnose a deadlock from one dump?
A single dump may expose a lock cycle, especially when lock ownership is included. Verify the waiter-owner chain; if the incident is intermittent or unclear, gather further evidence.
Should I use a thread dump or a heap dump?
Use a thread dump to inspect threads, stacks, states, and locks. A heap dump addresses objects and memory references; it answers a different diagnostic question.


