Time-Series Databases for Website Monitoring
Learn how time-series databases store website metrics, how Prometheus fits, and how to choose storage for your monitoring workload.
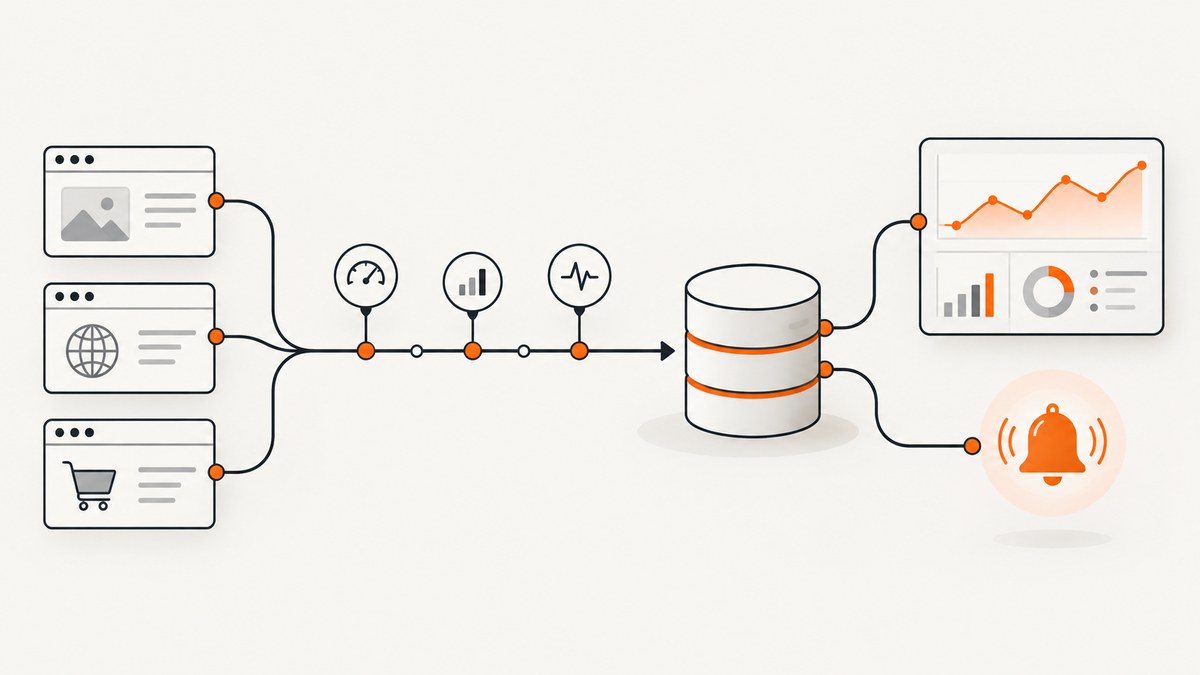
A time-series database stores measurements alongside the times they were recorded. In website monitoring, those measurements might include request counts, response durations, error totals, CPU use, or the number of active connections. The database retains samples, answers questions over time windows, and supplies data to dashboards and alert rules.
Prometheus is a useful example: it commonly scrapes metrics from targets over HTTP, stores them in local time-series storage, and evaluates rules. Its local storage is a single-node store; it is not a replicated cluster. The right backend depends on how you collect metrics, how many distinct series you create, which queries you run, how long you retain data, and what resilience and operating effort you need.
1. What is a time-series database doing in website monitoring?
It keeps a history of numerical measurements so you can ask questions such as “How many requests failed in the last 15 minutes?” or “Did the 95th-percentile response time rise after the deploy?” A time-series sample pairs a value with a timestamp and a series identity.
In Prometheus, a series is identified by a metric name and optional key-value labels. For example, http_requests_total{method="GET",status="200"} is distinct from the same metric with a different status label. PromQL can select, correlate, and transform series for dashboards and alerts. See the Prometheus overview and Prometheus project documentation.
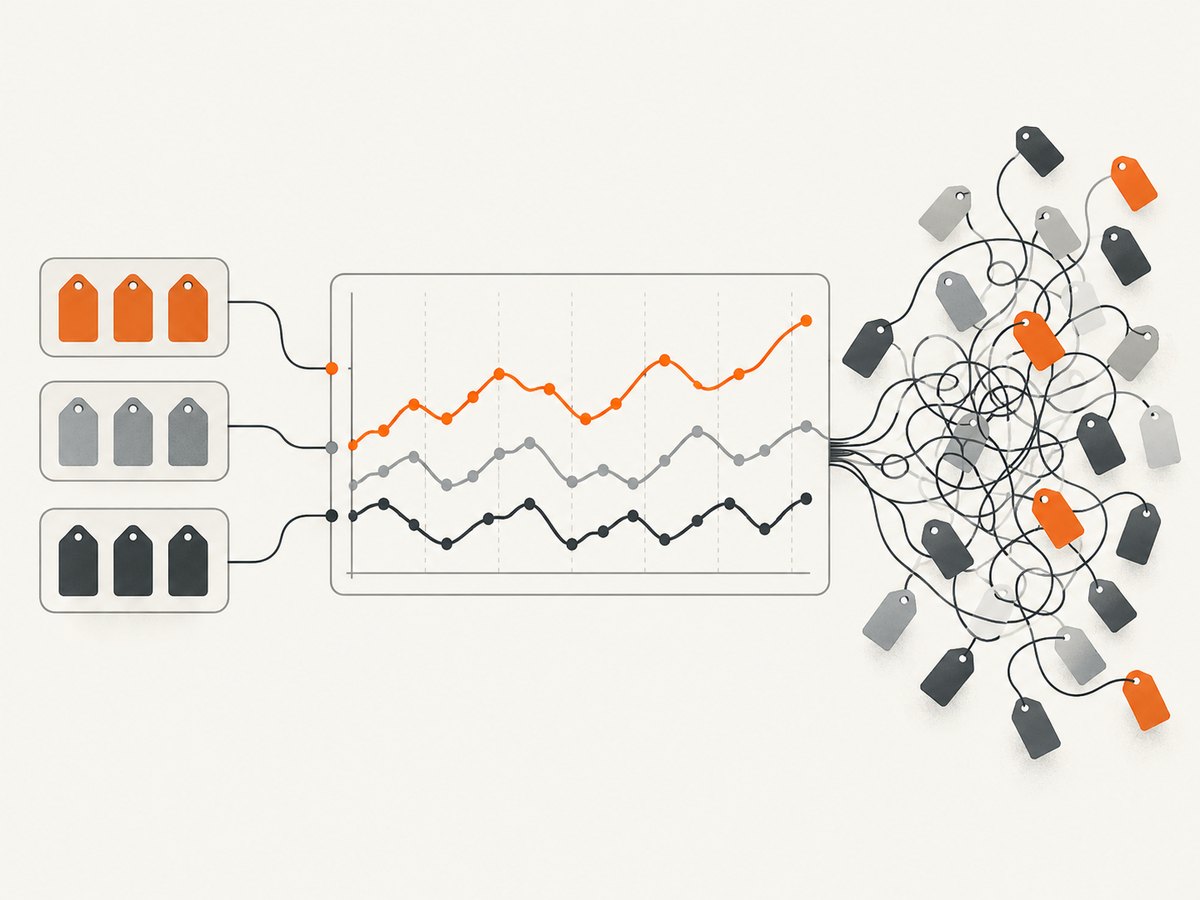
That identity model makes it easy to break down a metric by meaningful dimensions, but each distinct label combination can create another active series. Labels such as a route template or status code are often useful; a unique user ID or full URL can create uncontrolled series growth. Choose labels that help answer operational questions, and keep request-specific details in logs or traces.
2. The monitoring pipeline: collection to alert
A database is one component in a monitoring system. A typical path looks like this:
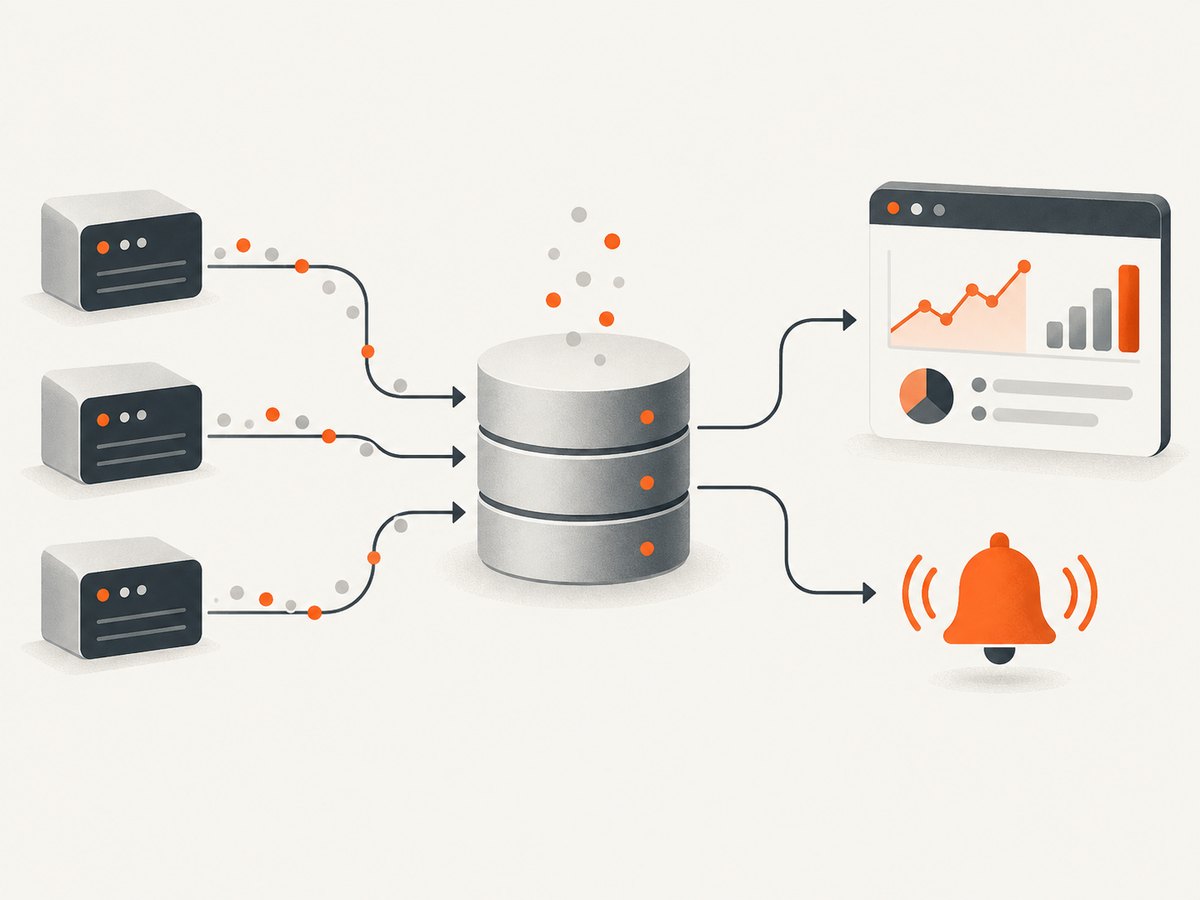
- Instrument: the website or its runtime exposes counters, gauges, or duration measurements.
- Collect: a collector obtains samples. Prometheus commonly scrapes instrumented jobs over HTTP; it also documents gateway support for certain jobs.
- Store: the backend associates samples with their metric name, labels, and timestamps, then retains them according to its storage policy.
- Query and visualize: PromQL or another query interface produces values and time ranges for Grafana or another API consumer.
- Evaluate and notify: rules can calculate recording metrics or evaluate alert conditions; an alerting component handles notification workflows.
Prometheus describes this scrape, storage, rules, and query-client workflow in its overview. Keep responsibilities clear when comparing products: a collector, metrics store, dashboard, and notification service can be separate products or parts of one deployment.
3. A small Prometheus example
Prometheus scrapes targets that expose metrics in a supported format. This minimal configuration scrapes Prometheus itself and a website metrics endpoint that you operate at web:9100. Replace that target with the reachable address and port for your instrumentation endpoint.
global:
  scrape_interval: 15s
  evaluation_interval: 15s

scrape_configs:
  - job_name: prometheus
    static_configs:
      - targets: ["localhost:9090"]

  - job_name: website
    metrics_path: /metrics
    static_configs:
      - targets: ["web:9100"]
Save this as prometheus.yml and start a local Prometheus server with the configuration file:
prometheus --config.file=prometheus.ymlThe prometheus executable must be installed and the target must be reachable from the Prometheus process. If you use a different scrape interval, account for the increased or reduced sample volume and how quickly you need to detect changes. For production, configure storage and retention deliberately rather than relying on an unexamined default.
Once a target exposes an appropriate counter, a basic PromQL query can calculate a request rate over five minutes:
sum by (job) (rate(http_requests_total[5m]))The query assumes that the target actually exports a counter named http_requests_total. Metric names vary by instrumentation. A counter accumulates; rate estimates its per-second increase over the selected window and handles counter resets. For an alert or dashboard, validate that the selected series and labels match your instrumentation before relying on the result.
4. How to choose a metrics backend
Start with a short workload description, then compare systems against it. Prometheus is a reasonable example for teams that want open-source, scrape-oriented collection and can operate local storage. VictoriaMetrics documents Prometheus compatibility, multiple ingestion protocols, a single-instance option, and a clustered option. Those are product capabilities described by its vendor; capacity and performance statements should be treated as vendor claims, not neutral benchmarks. See the VictoriaMetrics product information and documentation index.
| Decision area | Questions to answer | Why it matters |
|---|---|---|
| Ingestion | Do you scrape targets, push batches, or need several exposition protocols? | Existing instrumentation and collection patterns can determine integration effort. |
| Data model and queries | How are metrics and labels represented? Which query language do operators know? | Dashboards, alert rules, and ad hoc investigation depend on the query workflow. |
| Series and sample volume | How many active label combinations and samples per second are expected? | High or unpredictable cardinality affects resource use and troubleshooting. |
| Query mix | How many readers run which windows, aggregations, and dashboards concurrently? | A system suited to ingestion may not be the best fit for your read workload. |
| Retention and resilience | How long is data useful? What are backup, replication, and recovery expectations? | Retention increases storage needs; resilience requires an explicit architecture. |
| Operations and cost | Who upgrades, monitors, secures, and restores the store? What resource or service costs apply? | Self-hosting shifts operational work to your team; managed offerings shift some work to a provider. |
InfluxData’s cited platform page describes InfluxDB 1.x, including ingestion and querying, downsampling, retention policies, and the TICK stack. Those details are version-scoped; do not assume they describe InfluxDB 2.x or 3.x without checking documentation for the version you plan to use. See the InfluxDB 1.x platform page.
Do not choose from a single benchmark number. Benchmark relevance depends on the version, hardware, series shape, ingestion rate and batch size, query mix, concurrency, retention, and whether samples are regular or irregular. A 2026 preprint record lists benchmark dimensions including connection parallelism, batch ingestion, series regularity, multivariate series, mixed workloads, and system metrics; it is a list of workload dimensions, not a performance ranking. See the SciTSv2 preprint record.
5. Retention, disk, and resilience
Prometheus local storage is neither clustered nor replicated. A single local TSDB does not become a durable multi-node system simply because it runs in a production environment. Prometheus provides remote-write and remote-read interfaces for integrating remote storage where another storage system is needed. Decide whether you need remote storage, backups, replication, or a managed service based on recovery objectives and retention needs. See the Prometheus storage documentation.
Retention should reflect how far back operators need to investigate and what storage resources are available. Prometheus’s documentation gives a size-based headroom recommendation: keep retention size at no more than 80–85% of allocated Prometheus disk space, reserving 15–20% for temporary compaction space. This is Prometheus guidance for its storage, not a universal sizing guarantee. Track actual disk use and leave room for maintenance and growth.
Prometheus also says local storage requires a POSIX-compliant filesystem and warns against NFS implementations for local storage because of corruption risk. Check the current storage documentation for supported storage arrangements before choosing a volume or filesystem.
Prometheus is designed to help operators diagnose outages, but its overview says it is not the right tool when 100% accuracy is required, such as per-request billing. Monitoring samples and aggregates should not be treated as an accounting ledger.
6. Capacity planning and performance
Estimate the workload before sizing or comparing backends. Write down the number of targets, scrape interval, metrics per target, expected active label combinations, retention period, and the dashboards and alerts that will query the data. This estimate will not replace measurement, but it gives you a repeatable starting point.
- Control cardinality: avoid labels with unbounded values, such as request IDs, email addresses, or raw URLs. Prefer bounded dimensions that answer real questions.
- Review scrape frequency: shorter intervals can improve visibility while increasing sample volume and collection work. Use them where the monitoring need justifies them.
- Separate metric and event questions: metrics summarize behavior over time; request-level investigations may need logs or traces.
- Test representative queries: include dashboard refreshes, broad time ranges, alert evaluations, and concurrent readers.
- Measure in your environment: record ingestion behavior, query latency, resource use, and recovery behavior on the versions and hardware you will run.
For a useful comparison, run the same data shape and representative query mix on each candidate. Include both steady-state ingestion and the periods that matter operationally, such as a traffic spike or a dashboard load during an incident. State the hardware, software versions, retention settings, and workload. Without those details, a number is difficult to apply to your site.
7. Reliability, operations, and cost
Self-hosting means your team owns upgrades, storage capacity, access control, backups or remote-storage integration, and monitoring of the monitoring system. A managed option may reduce some infrastructure work, but compare its current service boundaries, retention terms, recovery behavior, and pricing directly. The research sources do not establish a controlled cost comparison or universal storage cost.
Prometheus documentation describes its local store as suitable for many monitoring needs while being explicit about the single-node, non-replicated design. For larger deployments, longer-term retention, or stronger availability requirements, design remote storage or choose a system whose documented topology meets those needs. VictoriaMetrics documents both single-instance and cluster configurations; confirm the operational details and limits for the specific edition and deployment you are evaluating.
Plan for failure modes before an incident: what happens if a scrape target is down, disk space runs low, a node is lost, or a remote destination is unavailable? Decide how alerts should behave when data is missing, and test restoration and failover procedures. A dashboard showing stale values should not be mistaken for current health.
8. Troubleshooting common problems
| Symptom | Likely cause | What to check or change |
|---|---|---|
| Target is down or absent | Wrong address, port, path, network route, or target process. | Check the target’s reachability from the scraper, confirm the metrics path and port, and inspect scrape status and logs. |
| Query returns no series | Metric name differs, labels filter everything out, target has not been scraped, or the time range has no samples. | Inspect available series and labels, broaden the time window, and verify that the target exports the metric. |
| Rate looks empty or erratic | Too few samples in the selected window, counter resets, or the metric is a gauge rather than a counter. | Use a window suited to the scrape interval; apply rate functions to counters, and select an appropriate calculation for gauges. |
| Storage grows faster than expected | More active series, labels with many unique values, higher sample rate, or longer retention. | Inspect series and label usage, remove unnecessary high-cardinality labels, review scrape frequency and retention. |
| Queries or dashboards are slow | Expensive broad queries, too many concurrent readers, large time ranges, or constrained resources. | Test representative queries, reduce unnecessary refreshes, narrow ranges where suitable, and measure the actual bottleneck. |
| Local data is unavailable after node or disk failure | Local Prometheus storage is single-node and not replicated. | Use a recovery plan and configure remote storage or a topology with the resilience you require. |
| Local storage corruption risk | Unsupported filesystem choice, including an NFS implementation. | Use a supported POSIX-compliant filesystem and consult the current Prometheus storage guidance. |
9. Capture a page image alongside metric monitoring
Metrics explain how a site behaved over time; a screenshot can preserve what a page looked like at a specific URL. For visual checks or documentation, ScreenshotNeo is a website screenshot API and MCP server from ScreenshotNeo. It accepts one GET request with a URL and returns PNG, JPEG, WebP, or PDF. Its documented options include full-page capture, CSS selector capture, viewport and device presets, dark mode, custom CSS and JavaScript, waits, headers, cookies, caching, and asynchronous jobs. See the ScreenshotNeo API documentation.
Or skip the browser setup
Use a single request to capture a page:
curl -G "https://api.screenshotneo.com/v1/shot" -d access_key=YOUR_API_KEY --data-urlencode url=https://stripe.com -o shot.webpCookie banners, popups, and chat widgets are removed before the shot. Bot checks, blank pages, and failed loads are never billed. An MCP server lets AI agents take screenshots. The free plan includes 1,000 screenshots a month with no card; paid plans start at $5 for 3,000. Sign up free for ScreenshotNeo.
10. A practical selection checklist
- List the metrics, targets, scrape or push method, and instrumentation you already have.
- Estimate active series, sample rate, retention, and query concurrency; identify labels that may grow without bounds.
- Write down the dashboard and alert queries operators need during routine work and incidents.
- Set recovery expectations for node loss, disk failure, backups, and access to older data.
- Compare documented ingestion protocols, data model, query workflow, topology, and operations for each candidate.
- Run representative workloads on the intended versions and hardware, and record the setup alongside results.
- Include staffing and service costs in the decision; revisit estimates when instrumentation or retention changes.
The practical choice is the system whose collection model, data behavior, retention, resilience, and operating burden fit your actual monitoring job. Prometheus provides a clear scrape-oriented starting point, while its local storage limits should be part of the design from the beginning.
11. FAQ
Is a time-series database only for metrics?
No. Time-series databases can store other timestamped numerical measurements too. This guide focuses on metrics because they are a common input to website monitoring.
Can Prometheus replace a dashboard?
Prometheus exposes query interfaces and can be used by visualization clients such as Grafana. The monitoring architecture may use separate components for storage, visualization, and alert delivery.
Should I use metrics to record every individual request for billing?
No. Prometheus explicitly cautions that it is not the right choice where 100% accuracy is required. Use an accounting design that provides the accuracy and auditability your billing process needs.
Does a cluster automatically solve retention and recovery?
No. Verify what the selected topology replicates, how it handles failure, and how data is backed up and restored. Retention policy and recovery planning remain explicit design decisions.


