Top Monitoring Tools for Website Availability
Compare uptime, API, browser journey, performance, and status-page monitoring tools, then choose a service that matches your failure modes.

Short answer: choose a monitoring service by what you need to prove. Endpoint checks confirm that a URL or port responds. API and protocol checks validate services beyond a homepage. Browser transactions test real journeys such as login and checkout. Performance monitors measure loading and web vitals. Status pages communicate incidents publicly; they do not detect incidents for you.
There is no universal best tool. Pingdom is a candidate for teams combining synthetic uptime, page speed, business transactions, and real-user monitoring. UptimeRobot suits teams that need several endpoint and protocol check types plus status pages. New Relic fits teams that want synthetic checks tied to Core Web Vitals, broken links, content load, and SSL validity. Verify current limits and prices before subscribing because vendor plans change.
Match the monitor to the failure you need to catch
| Need | Monitor type | What it proves | What it misses |
|---|---|---|---|
| Know whether a site responds | HTTP/HTTPS uptime | Status code, response, and often response time | Broken login, failed checkout, unusable JavaScript |
| Check a service or integration | API, TCP/UDP, DNS, SSL, heartbeat, or keyword check | Protocol-specific behavior or expected content | Full browser rendering and user interaction |
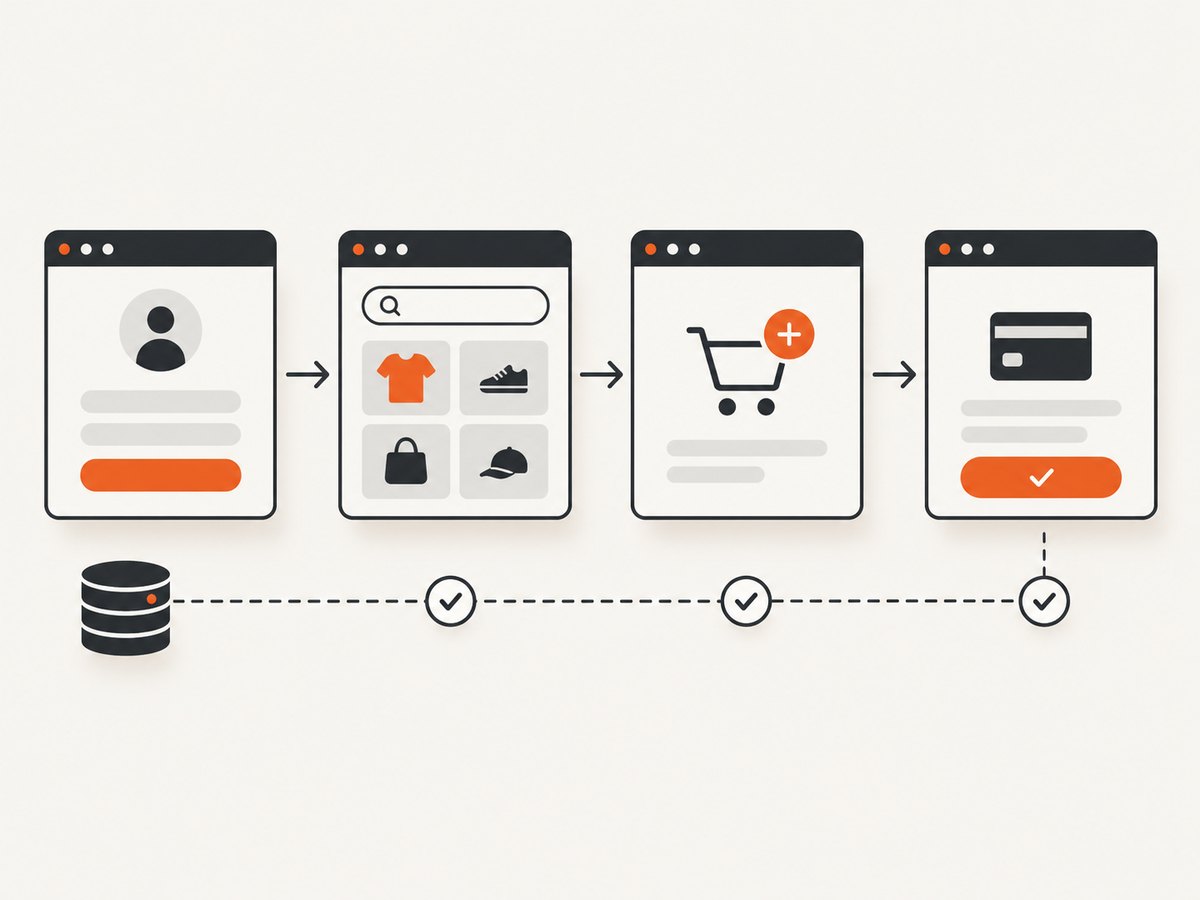
| Validate a customer journey | Browser transaction or synthetic journey | Steps such as sign-in, search, cart, and payment handoff | Every possible user path and real-user conditions |
| Find slow pages | Page-speed or performance monitor | Load timing, Core Web Vitals, content load, and related signals | Business correctness by itself |
| Tell customers what is happening | Public status page | A controlled incident communication channel | Detection and root-cause analysis |
Recommended tools by use case
Pingdom: synthetic availability, transactions, and RUM
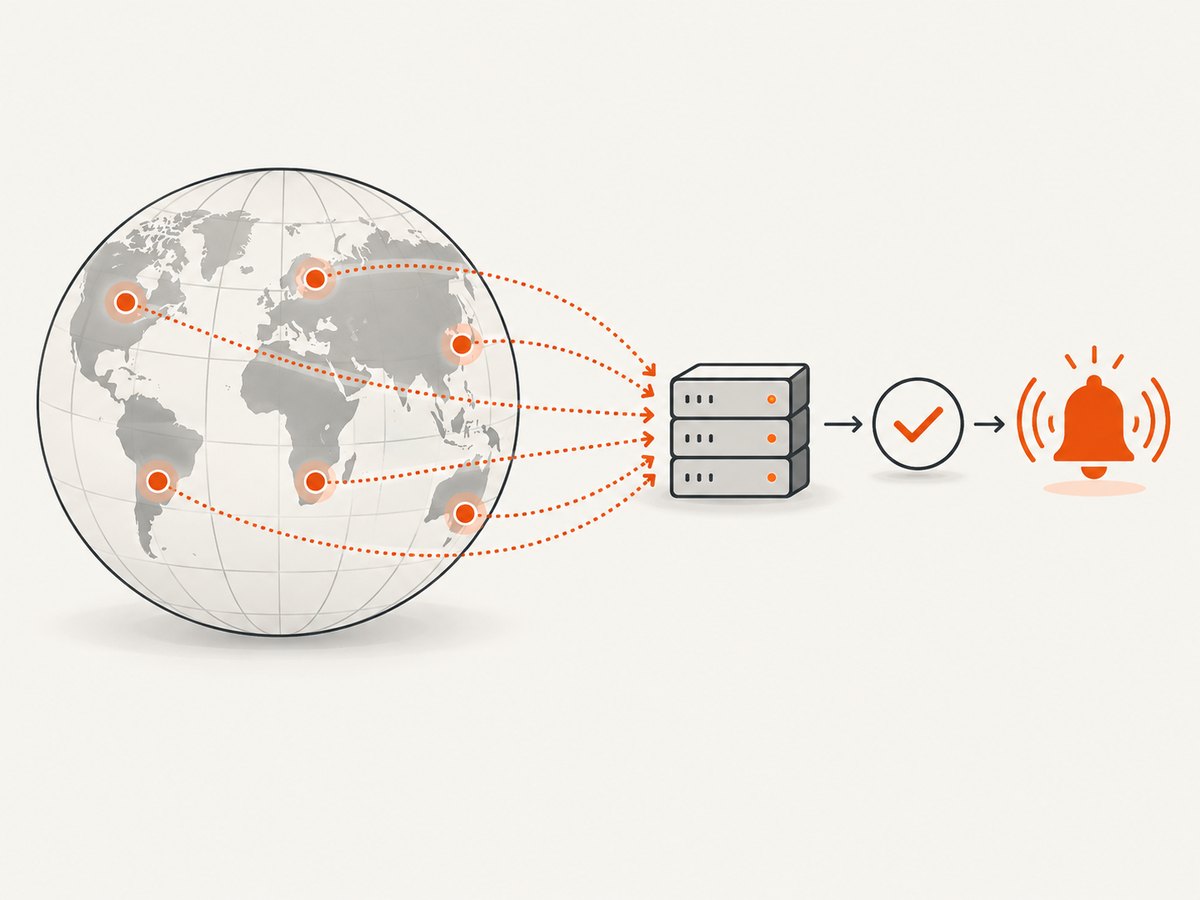
Pingdom’s pricing page lists uptime, page-speed, and transaction monitoring, email and SMS alerts, maintenance windows, public status pages, and reports. Its separate real-user monitoring product describes performance insight from users’ perspective, shareable reports, and 13 months of data retention. The uptime product page says it monitors websites, applications, and servers; supports SMS, email, and webhook alerts; performs a second check on incidents before alerting; monitors from regions including North America, South America, Europe, Asia, and Australia; and provides details such as traceroute, server output, and response codes. These are vendor claims, so confirm the current plan and trial terms before purchase.
Check Pingdom pricing and included quantities and review its uptime monitoring features.
UptimeRobot: broad endpoint and protocol coverage
UptimeRobot’s official materials list HTTP/HTTPS, keyword, ping, port, cron or heartbeat, DNS-change, SSL-certificate, domain-expiry, and response-time monitoring. It also advertises API and endpoint checks and real-time status pages. Its pricing page shows interval tiers displayed as 5 minutes, 60 seconds, 30 seconds, and 15 seconds, with plan-dependent monitor types, regional monitoring, alerting, status-page capacity, and retention. Confirm the live plan matrix because feature labels and limits can change.
Review UptimeRobot monitor types and verify current intervals and quotas.
New Relic: synthetic checks with web-performance signals
New Relic describes synthetic website checks for page availability, Core Web Vitals, page and content load, broken links, and SSL validity. Its product page lists 500 monthly checks in Free, 10,000 checks in Standard, and a half-cent per additional check for Standard and Pro. It also lists 12 public geolocations. The page says supplying a credit card unlocks 10,000 free checks each month; read the current offer carefully before relying on it.
See New Relic’s current website performance monitoring details.
How to choose a monitoring service
- List the failure modes. Include DNS, TLS expiry, origin reachability, API responses, JavaScript errors, authentication, checkout, queues, and third-party dependencies.
- Pick the smallest monitor that proves each requirement. An HTTP check is cheaper and simpler than a browser transaction, but it cannot prove that a user can complete a flow.
- Choose check locations near your users and infrastructure. A single region can miss routing or regional failures.
- Read failure-confirmation behavior. Pingdom says it performs a second incident check before alerting. Other services may use retries, multiple locations, or configurable confirmation windows.
- Set an interval based on impact. A 15-second check notices an outage sooner than a 5-minute check and usually consumes more quota.
- Map alerts to ownership. Use at least one immediate channel and one durable channel such as email, webhook, or an incident system. Avoid routing every low-severity performance warning to the on-call phone.
- Separate detection from communication. Monitoring alerts wake the team; a public status page gives customers a consistent incident update.
- Calculate the pricing unit. Compare monitor count, check frequency, locations, browser-run minutes, data retention, alert seats, and overage charges. A “free” label does not describe the actual monthly capacity.
DIY endpoint monitoring
A basic check can run from cron, a CI worker, or a small scheduled job. It should enforce a timeout, accept only expected status codes, and report failures to the alerting system you already use.
cURL
#!/usr/bin/env bash
set -euo pipefail
url="https://example.com/healthz"
code="$(curl --silent --show-error --output /dev/null --write-out '%{http_code}' --max-time 15 "$url")"
if [ "$code" != "200" ]; then
  echo "health check failed: HTTP $code" >&2
  exit 1
fi
echo "healthy: HTTP $code"
Python
import sys
import requests

URL = "https://example.com/healthz"
try:
    response = requests.get(URL, timeout=(5, 15))
    response.raise_for_status()
except requests.RequestException as exc:
    print(f"health check failed: {exc}", file=sys.stderr)
    sys.exit(1)

if response.status_code != 200:
    print(f"unexpected status: {response.status_code}", file=sys.stderr)
    sys.exit(1)
print(f"healthy: HTTP {response.status_code}")
Node.js
const controller = new AbortController();
const timer = setTimeout(() => controller.abort(), 15000);
try {
  const response = await fetch('https://example.com/healthz', {
    signal: controller.signal,
    headers: { accept: 'application/json' }
  });
  if (response.status !== 200) {
    throw new Error(`unexpected status: ${response.status}`);
  }
  console.log(`healthy: HTTP ${response.status}`);
} catch (error) {
  console.error(`health check failed: ${error.message}`);
  process.exitCode = 1;
} finally {
  clearTimeout(timer);
}
DIY browser journey checks
Use a browser runner when availability means that a user can complete several steps. The following Playwright example checks a login page, submits credentials supplied through environment variables, and verifies a post-login selector. Store secrets in your CI secret manager.
import { chromium } from 'playwright';

const browser = await chromium.launch();
const page = await browser.newPage();
try {
  await page.goto('https://example.com/login', { waitUntil: 'networkidle', timeout: 30000 });
  await page.getByLabel('Email').fill(process.env.TEST_EMAIL);
  await page.getByLabel('Password').fill(process.env.TEST_PASSWORD);
  await page.getByRole('button', { name: 'Sign in' }).click();
  await page.locator('[data-testid="account-home"]').waitFor({ timeout: 15000 });
  console.log('login journey passed');
} finally {
  await browser.close();
}
Keep synthetic accounts isolated from production data. Make the journey idempotent, mask credentials in logs, and assert a meaningful result instead of merely checking that a page loaded.
Operational checklist
- Define expected status codes, response body markers, and latency thresholds.
- Use at least two relevant geographic locations for critical services.
- Configure maintenance windows for planned deployments.
- Require confirmation or retries before paging for transient network errors.
- Test alert delivery and escalation after every routing change.
- Record monitor ownership, runbook links, and dependency context.
- Review false positives and false negatives monthly.
- Retain enough history to compare incidents with deploys and traffic changes.
Performance, reliability, and cost considerations
Frequency: shorter intervals reduce detection delay but increase check consumption and noise. Set the interval from your recovery objective, not from a generic “real-time” label.
Locations: one failed probe can be a local routing problem. Prefer services that let you select locations relevant to customers and require confirmation before paging.
Browser cost: browser transactions use more CPU and time than HTTP checks. Reserve them for high-value journeys and use endpoint checks for simpler dependencies.
Retention: incident analysis needs historical response times, status codes, and alert events. Compare retention limits; Pingdom’s RUM page, for example, describes 13 months of data retention.
Pricing: calculate checks as monitor count multiplied by frequency and locations, then add browser runs, seats, data retention, and overage. New Relic lists 500 monthly checks in Free, 10,000 in Standard, and a half-cent per additional check for Standard and Pro. UptimeRobot’s displayed interval tiers range from 5 minutes to 15 seconds. These figures are vendor-published and may change.
Or skip the browser setup
When you need visual evidence that a page renders, ScreenshotNeo provides a single screenshot API request. Cookie and consent banners, newsletter popups, and chat widgets are removed before the shot; bot checks, blank pages, timeouts, failed loads, and cache hits are not billed. Response headers identify the page verdict and whether it was billed. An MCP server lets Claude, Cursor, and other MCP clients use take_screenshot, get_page_info, and capture_pdf. The free plan includes 1,000 screenshots each month with no card; paid plans start at $5 for 3,000.
See the ScreenshotNeo API documentation for all options.
curl -G "https://api.screenshotneo.com/v1/shot" -d access_key=YOUR_API_KEY --data-urlencode url=https://stripe.com -o shot.webpimport requests
r = requests.get("https://api.screenshotneo.com/v1/shot", params={"access_key": "YOUR_API_KEY", "url": "https://stripe.com"}, timeout=90)
open("shot.webp", "wb").write(r.content)const q = new URLSearchParams({ access_key: 'YOUR_API_KEY', url: 'https://stripe.com' });
const res = await fetch(`https://api.screenshotneo.com/v1/shot?${q}`);Create a free ScreenshotNeo account with 1,000 screenshots per month and no card.
Troubleshooting common monitoring failures
| Symptom | Likely cause | Fix |
|---|---|---|
| Alerts fire during brief network blips | Single probe with no confirmation | Enable retries, multi-location confirmation, or a second check before paging. |
| Homepage is green but checkout is broken | Only endpoint monitoring is configured | Add a browser transaction that reaches the checkout result. |
| Checks fail only from one region | Regional DNS, routing, firewall, or CDN issue | Compare locations and investigate the affected network path. |
| Browser monitor is flaky | Race conditions, third-party scripts, or unstable selectors | Wait for a stable selector, use resilient locators, and isolate third-party dependencies where possible. |
| Expected outage is not alerted | Maintenance window, wrong URL, or disabled monitor | Review schedule, monitor status, destination, and recent configuration changes. |
| Costs exceed the estimate | High frequency, many locations, browser runs, or overage | Recalculate monthly checks and move low-risk checks to a longer interval. |
| Status page says operational during an outage | Status page is separate from detection | Connect incident workflows or update the page from the on-call runbook. |
FAQ
How do I know when my website is down?
Use an external monitor that checks from a location outside your hosting network, confirms failures, and sends an alert. Add a browser journey when a successful HTTP response does not prove that users can complete the important action.
How many locations should I monitor from?
Start with locations that represent your customers and your critical infrastructure. Add more when regional routing or compliance requirements make a single vantage point insufficient.
Are public status pages monitoring tools?
They communicate incident state to customers. They do not replace probes, alerting, or incident investigation.
Should every page use a browser transaction?
No. Use inexpensive endpoint or protocol checks for simple dependencies and reserve browser runs for critical user journeys.
How often should I review monitors?
Review them after major architecture, authentication, DNS, or deployment changes, and periodically for ownership, alert routing, false positives, and quota usage.


