How to Troubleshoot Selenium Grid Tests on Kubernetes
A practical, evidence-first guide to debugging Selenium Grid routing, browser pods, scheduling, readiness, logs, traces, and timeouts on Kubernetes.
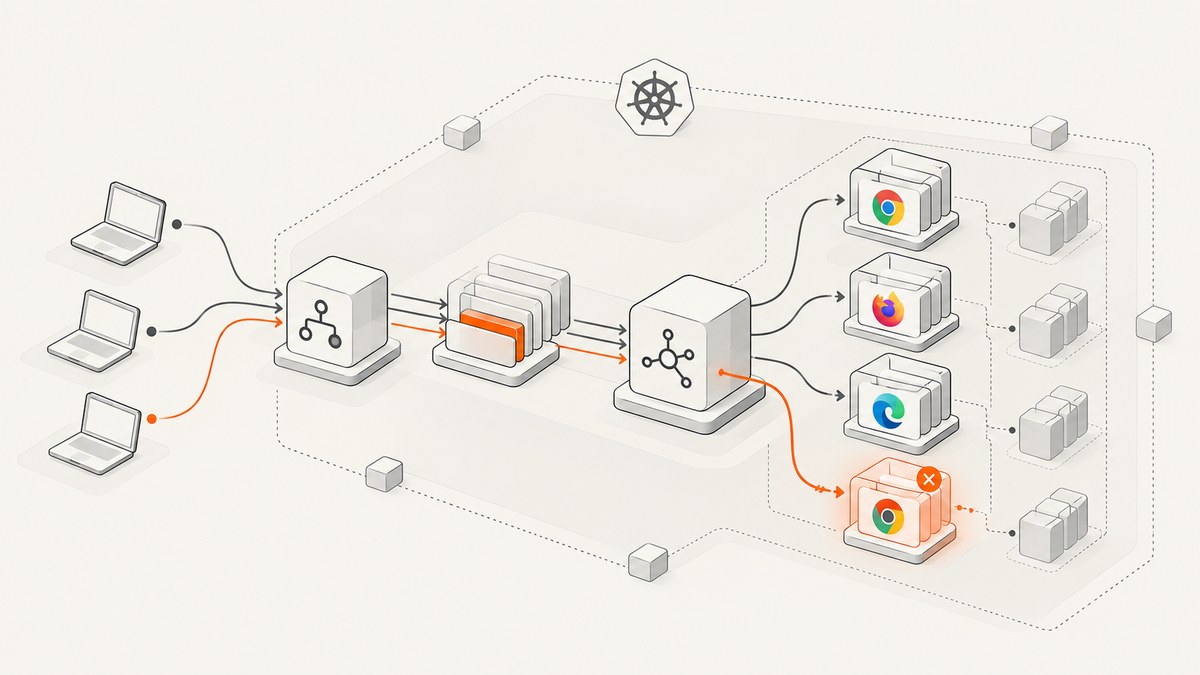
Selenium Grid failures on Kubernetes usually cross two systems: the WebDriver request path and the Kubernetes workload lifecycle. Start by identifying the failing boundary, inspect Grid status and queue data, then correlate the session with Grid logs, traces, pod events, and browser startup details. A reachable Grid UI does not prove that Nodes are registered or that new sessions can be allocated.
1. Capture the failure before changing anything
Preserve the evidence that lets you follow one request through the system:
- The complete WebDriver exception and stack trace.
- Test name, session ID (if one exists), timestamp, timezone, Grid version, and SeleniumHQ Helm chart version.
- Requested browser, platform, browser version, and other capabilities.
- The namespace, Grid service endpoint, relevant Pod names, and Kubernetes Node names.
- The observed boundary: the client cannot reach Grid; Grid is reachable but cannot create a session; a session starts and then fails; or browser Pods cannot schedule or become ready.
Do not delete or restart Pods until you have collected logs and events. Restarting can remove the evidence needed to distinguish a routing problem from a scheduling or browser-startup problem.
2. Check the Grid request path
Selenium Grid’s distributed path commonly includes the Router, Session Queue, Distributor, Session Map, Event Bus, and browser Nodes. A request can fail at any of these points. The Grid endpoints documentation describes status, Node, session, and queue information; the architecture guide explains the component roles and default distributed ports.
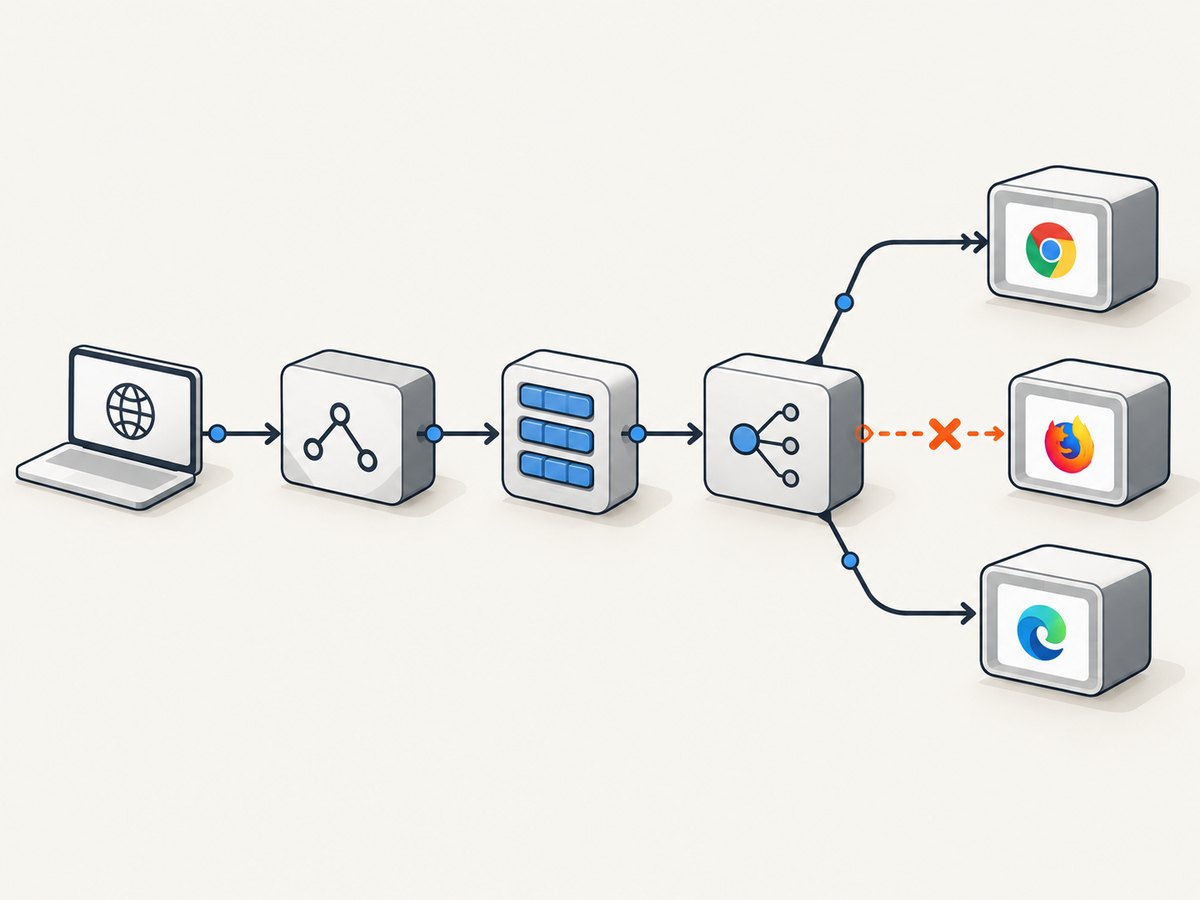
Query status
curl -sS http://<grid-host>:<port>/status | jqInspect whether the Grid reports readiness, how many Nodes are registered, and whether the Grid is accepting new sessions. If your deployment uses a path prefix or an ingress, use the externally configured URL instead of assuming the default root path.
Inspect Nodes, slots, and sessions
Use the Grid’s documented endpoints for your Selenium release to inspect registered Nodes and session ownership. Look for:
- Nodes marked available versus unavailable.
- Free slots and the stereotypes they advertise.
- Existing sessions consuming the matching slots.
- A new-session queue that grows while no compatible slot becomes free.
A capability mismatch can look like a capacity problem: the Grid may have free slots, but none with the requested browser or platform stereotype. A missing Node registration, a broken internal service connection, or a queue that cannot reach the Distributor can produce the same client-side timeout.
Check the queue before increasing timeouts
If session creation hangs, compare queued requests with free compatible slots. Increasing the WebDriver timeout only makes the client wait longer; it does not create a slot, repair registration, or fix a capability mismatch.
3. Correlate logs and traces
Selenium describes observability through traces, metrics, and logs. Use the failing test timestamp and session ID to follow the request across Router, Session Queue, Distributor, and Node logs. Structured fields such as timestamps, trace IDs, span IDs, event names, and attributes make this correlation possible.
kubectl -n <namespace> logs deploy/<router-deployment> --all-containers --since=30m
kubectl -n <namespace> logs deploy/<distributor-deployment> --all-containers --since=30m
kubectl -n <namespace> logs deploy/<session-queue-deployment> --all-containers --since=30m
kubectl -n <namespace> logs <browser-pod> --all-containers --since=30m
Tracing is documented as enabled by default in Selenium’s observability material, but exporters, log formats, and defaults depend on the deployed release. Check your image and chart configuration before relying on a particular exporter or field.
4. Inspect Kubernetes Pods, events, and Nodes
Kubernetes separates application debugging from cluster debugging. Follow the workflow in the Kubernetes application troubleshooting guide and its debugging overview.
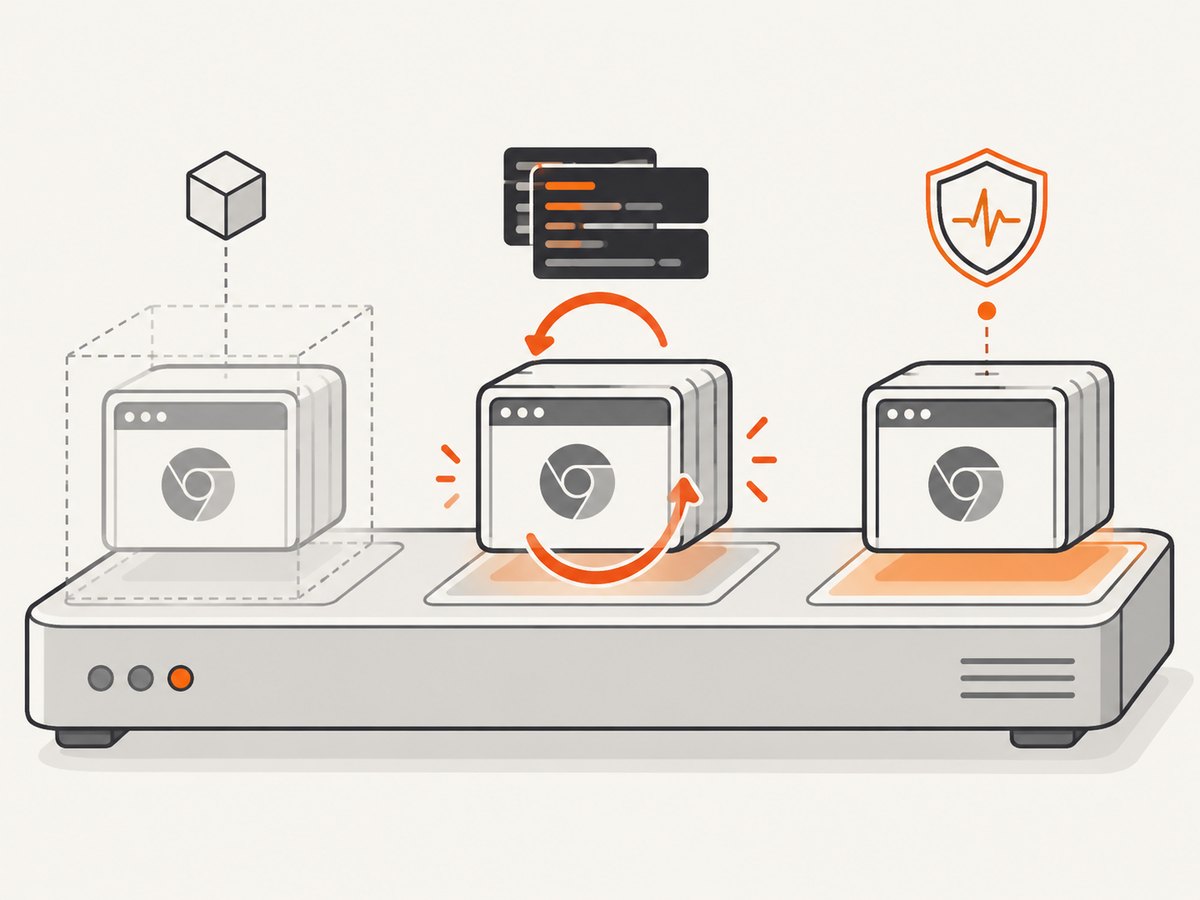
kubectl -n <namespace> get pods -o wide
kubectl -n <namespace> describe pod <pod>
kubectl -n <namespace> get events --sort-by=.metadata.creationTimestamp
kubectl -n <namespace> logs <pod> --all-containers
kubectl get nodes
kubectl describe node <node>
Pod is Pending or unscheduled
Read the Events section of kubectl describe pod. Common evidence includes insufficient CPU or memory, an unmatched node selector, taints without tolerations, unavailable PersistentVolumes, or an image that cannot be pulled. Confirm the Node is Ready and has allocatable resources. Check that the Pod is being created in the namespace expected by the Grid configuration.
Pod starts and exits
Inspect container logs and termination details:
kubectl -n <namespace> get pod <pod> -o jsonpath='{.status.containerStatuses[*].state}'
kubectl -n <namespace> get pod <pod> -o jsonpath='{.status.containerStatuses[*].lastState}'
Exit reasons, OOM kills, failed browser-server startup, and image-entrypoint errors point to different fixes. Capture the termination message before restarting the Pod.
Pod is Running but not Ready
Compare the configured readiness probe with the endpoint exposed by the deployed image. SeleniumHQ’s chart documentation currently shows /readyz examples for Router and Distributor components and /status examples for browser Nodes; verify the rendered manifests and chart version before changing probes. A probe that targets the wrong port or path can keep a healthy process out of service.
5. Validate Kubernetes-specific Selenium configuration
Selenium’s CLI options include Kubernetes settings whose names and defaults can change between releases. Compare the deployed arguments and environment with the chart and image documentation.
| Setting | What to verify | Typical symptom when wrong |
|---|---|---|
| Browser image and image pull policy | Image exists, registry credentials work, and pull policy matches your rollout strategy. | Pods remain Pending or fail before the browser starts. |
| Namespace | Grid creates browser resources in the intended namespace. | Jobs or Pods appear missing from the namespace you inspect. |
| Service account | RBAC permits the Grid component to create, inspect, and remove browser resources. | Session requests fail while Kubernetes API calls show permission errors. |
| Resource requests and limits | Requests fit available Node capacity; limits do not cause browser OOM kills. | Pending Pods, evictions, or abrupt browser termination. |
| Node selector and tolerations | Scheduling rules match labels and taints on eligible Nodes. | Pods remain unscheduled despite apparent cluster capacity. |
| Browser-server startup timeout | Compare startup duration with --kubernetes-server-start-timeout. |
Grid abandons a browser Pod that is still starting. |
| Termination grace period | Allow sessions to drain or browsers to exit cleanly. | Sessions disappear during scale-down or cleanup. |
The CLI documentation displays 120 seconds as the Kubernetes browser-server startup timeout default for the referenced release. Treat that as version-specific configuration, not a universal performance target.
6. Diagnose “the UI works, but sessions do not”
A Grid UI can remain accessible while Nodes cannot be fetched or registered, or while queued requests are not accepted. SeleniumHQ’s Helm chart documentation describes a Distributor liveness mechanism that queries GraphQL for sessionCount and sessionQueueSize. In that chart, a queue greater than zero combined with zero sessions through the configured failure threshold can trigger a Distributor restart. This is a chart-specific recovery mechanism, not proof that every deployment has the same probe.
Inspect the rendered chart manifests and the actual Distributor logs before changing the probe. If Nodes are absent, fix registration, service discovery, credentials, or scheduling first; restarting the Distributor may only hide the underlying fault.
7. Match capabilities to Node stereotypes
Compare the test’s requested capabilities with the stereotypes reported by registered Nodes. Check browser name, browser version, platform, headless arguments, proxy requirements, and any vendor-specific capability keys. Remove accidental constraints while diagnosing, then restore the intended capabilities once a session can be allocated.
If the Grid has free slots but none match, the queue will grow until the client times out. If no Nodes are registered, capability changes will not help; return to Node registration and Kubernetes state.
8. Use targeted recovery
- Preserve Grid logs, traces, Pod descriptions, events, and termination details.
- Choose the failing layer: client reachability, Grid routing, Node registration, capability matching, scheduling, browser startup, or test execution.
- Make one change: correct an endpoint or capability, restore service connectivity, fix RBAC or scheduling, align a probe, or adjust a demonstrated startup constraint.
- Run one representative session and observe the same status, logs, and Pod events.
- Drain a Node before planned removal when your deployment supports it, allowing active sessions to finish. Selenium documents Node draining and endpoints for session ownership and queue state.
Do not expose the Grid while debugging. Selenium states: “Selenium Grid must be protected from external access using appropriate firewall permissions.” Its documentation warns that an exposed Grid can provide access to infrastructure, internal applications and files, or custom binary execution.
9. Common errors and fixes
| Observed error | Likely evidence | Fix direction |
|---|---|---|
| Connection refused or DNS failure | Client cannot resolve or connect to the Grid Service. | Check Service selectors, namespace, ingress or port-forwarding, NetworkPolicies, and the URL used by the test. |
| New session request times out | Queue grows, no compatible free slot, or Distributor/Node logs show a broken path. | Inspect queue, slots, stereotypes, registration, and component connectivity before raising timeouts. |
| Grid reports ready but no Nodes | /status is reachable; Node list is empty. |
Inspect browser Pod creation, service account permissions, image pulls, Node startup logs, and namespace settings. |
| Browser Pod Pending | Scheduling events cite resources, selectors, taints, volumes, or image pulls. | Resolve the specific scheduler event and verify Node capacity and labels. |
| Browser Pod CrashLoopBackOff | Previous termination state and container logs show the exit cause. | Fix image entrypoint, browser startup, missing dependencies, resource limits, or configuration. |
| Pod Running but Grid marks it unavailable | Readiness probe failures or Node /status errors. |
Check probe path, port, startup timing, and Node logs against the deployed version. |
| Sessions fail after starting | Session ID exists; Node logs show browser crash, proxy failure, or resource pressure. | Correlate the session with Node logs and inspect OOM, network, and browser-process events. |
| Sessions disappear during rollout | Pods terminate before sessions drain. | Use Node draining and an appropriate termination grace period. |
10. Performance, reliability, and cost considerations
- Measure the queue: Separate time waiting for a compatible slot from browser startup and test execution. These require different fixes.
- Reserve realistic resources: CPU and memory requests influence scheduling; limits that are too low can kill browsers, while oversized requests reduce packing efficiency.
- Use one representative diagnostic test: Reproducing with a single browser and capability set reduces queue noise while you isolate the failure.
- Keep observability searchable: Retain timestamps, session IDs, trace IDs, and Pod names together so a single failure can be reconstructed.
- Change one variable at a time: Simultaneous timeout, probe, image, and resource changes make the result impossible to interpret.
- Protect capacity: Apply appropriate concurrency limits and autoscaling policies for your cluster instead of assuming every browser session has the same resource profile.
Selenium’s CLI values and SeleniumHQ chart keys can change. Pin and review the documentation that matches your deployed Selenium image and chart version.
Or skip the browser setup
If your goal is a clean screenshot rather than interactive browser-test coverage, ScreenshotNeo provides a single HTTP request. It accepts consent banners before capture and removes more than 60 known consent platforms, newsletter popups, and chat widgets. Bot checks, CAPTCHAs, blank pages, timeouts, failed loads, and cache hits are not billed, and each response reports the result with X-Page-Verdict and X-Billed headers. Its MCP server lets Claude, Cursor, and other MCP clients use take_screenshot, get_page_info, and capture_pdf.
See the ScreenshotNeo API documentation for options such as full-page capture, element selectors, device presets, custom headers and cookies, waits, request blocking, PDF output, caching, signed links, asynchronous jobs, bulk capture, and usage reporting.
cURL
curl -G "https://api.screenshotneo.com/v1/shot" -d access_key=YOUR_API_KEY --data-urlencode url=https://stripe.com -o shot.webpPython
import requests
r = requests.get("https://api.screenshotneo.com/v1/shot", params={"access_key": "YOUR_API_KEY", "url": "https://stripe.com"}, timeout=90)
open("shot.webp", "wb").write(r.content)
Node.js
const q = new URLSearchParams({ access_key: 'YOUR_API_KEY', url: 'https://stripe.com' });
const res = await fetch(`https://api.screenshotneo.com/v1/shot?${q}`);
The Free plan includes 1,000 screenshots per month with no card. Paid plans start at $5 for 3,000 screenshots, and every feature is available on every plan. Create a free ScreenshotNeo account.
FAQ
Should I restart the Grid when the UI is reachable but tests time out?
First inspect /status, registered Nodes, compatible slots, queue state, and component logs. Restart only after preserving evidence and identifying an unhealthy component.
Why are browser Pods Pending when the cluster looks idle?
Scheduler decisions use requests, labels, taints, volumes, and other constraints. Read the Pod’s Events section and inspect the target Nodes instead of relying on aggregate utilization.
Is a longer browser startup timeout always safer?
No. Compare the timeout with observed image-pull and browser-startup durations. A longer value can mask a failing image, permission problem, or unschedulable Pod.
How do I know whether a timeout is a capability problem?
Compare requested capabilities with Node stereotypes and free slots. If compatible slots are absent while unrelated slots are available, simplify or correct the capabilities.
Can I expose Grid temporarily for debugging?
Keep it private and use controlled access such as an authenticated internal route or port-forward. Selenium warns that externally exposed Grid infrastructure can be abused.


