How to Use Python’s Debugger (pdb) and Beyond
Use pdb to trace a bad value, inspect the right stack frame, and investigate exceptions. See when VS Code’s debugger helps and how to build a repeatable workflow.
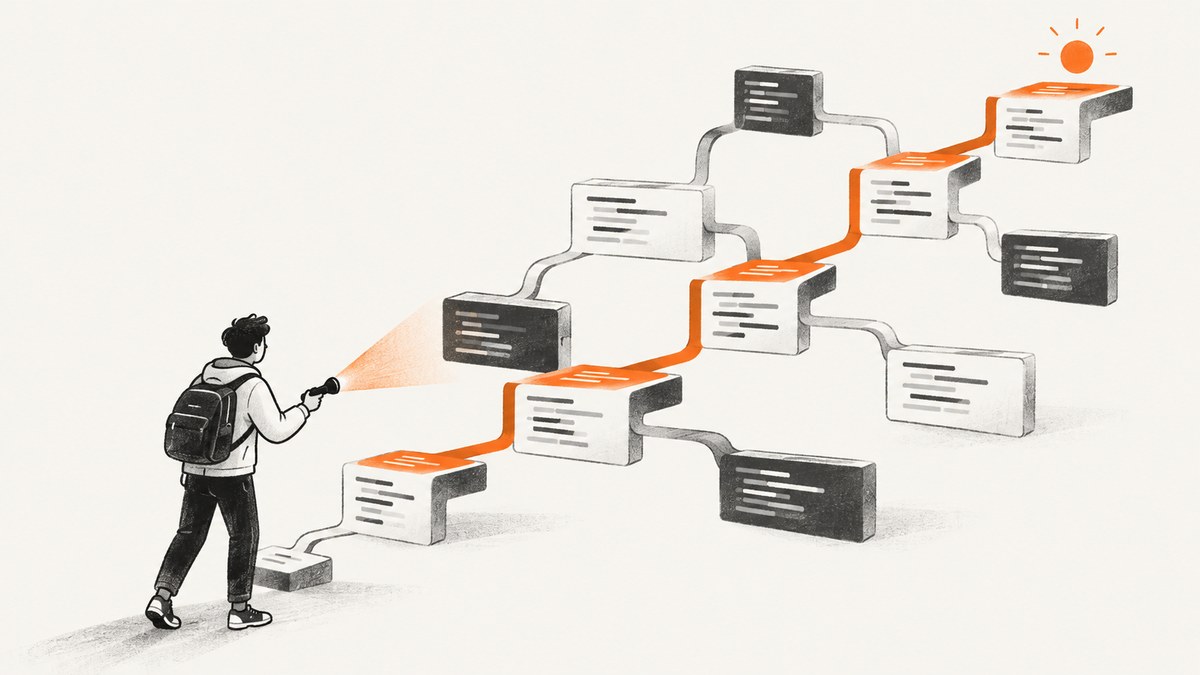
Python’s built-in pdb debugger lets you pause a program, inspect its live state, step through source lines, and examine the stack. For the quickest start, put breakpoint() where you want execution to stop, run the program with the input that triggers the problem, and use p expression, n, s, and c at the (Pdb) prompt. For failures that already occurred, run the script with python -m pdb or use post-mortem debugging. When visual state inspection or reusable project settings help, use the Python Debugger extension in VS Code.
This guide follows the Python 3.14.7 debugger reference. Version-specific behavior is called out where it matters. The same workflow applies to smaller scripts and larger applications: reproduce the issue, stop near the first suspicious value, inspect the frame that owns it, and proceed one step at a time.
1. Start with a breakpoint in your code
The simplest way to enter the debugger is Python’s built-in breakpoint() function, available since Python 3.7. It pauses at that line when the program reaches it. Add it just before the suspicious operation, then run the program normally with the same arguments, input, and environment that produced the problem.
def calculate_total(items):
    subtotal = sum(items)
    breakpoint()
    return subtotal

print(calculate_total([10, 20, 30]))
Save this as debug_example.py and run python debug_example.py. At the (Pdb) prompt, try:
(Pdb) p items
[10, 20, 30]
(Pdb) p subtotal
60
(Pdb) list
  1  def calculate_total(items):
  2      subtotal = sum(items)
  3      breakpoint()
  4      return subtotal
  5
  6  print(calculate_total([10, 20, 30]))
(Pdb) n
> debug_example.py(4)calculate_total()
(Pdb) p subtotal
60
(Pdb) c
60
Commands can be abbreviated when the abbreviation is unambiguous. Use h for the command list or help command for details, such as help break. When done, c continues until another breakpoint or program exit.
Core commands at a glance
| Command | What it does | When it helps |
|---|---|---|
p expression |
Evaluates and prints an expression in the selected frame. | Check a variable, property, comparison, or small calculation. |
pp expression |
Pretty-prints an expression. | Read nested dictionaries and collections. |
n / next |
Runs to the next line in the current function. | Follow local control flow without entering each call. |
s / step |
Runs the current line and enters a called function. | Investigate where a bad result is produced. |
r / return |
Continues until the current function returns. | Skip the rest of a function once its internals look sound. |
c / continue |
Resumes until a breakpoint or program end. | Let execution proceed after inspection. |
l / list |
Lists source near the current position. | Reorient yourself in a file. |
w / where |
Prints the stack trace, with the current frame marked. | See how execution reached this point. |
u / up, d / down |
Moves to an older or newer frame in the stack. | Inspect callers and trace data through layers. |
q / quit |
Exits the debugger and terminates the debugged program. | Stop a run when continuing is not useful. |
2. Step through a failure systematically
A breakpoint is most useful when it answers a specific question. Instead of stepping through an entire program, identify the earliest point where an assumption might become false: a parsed input, a database result, a branch condition, or a function’s return value. Then inspect what enters and leaves that boundary.
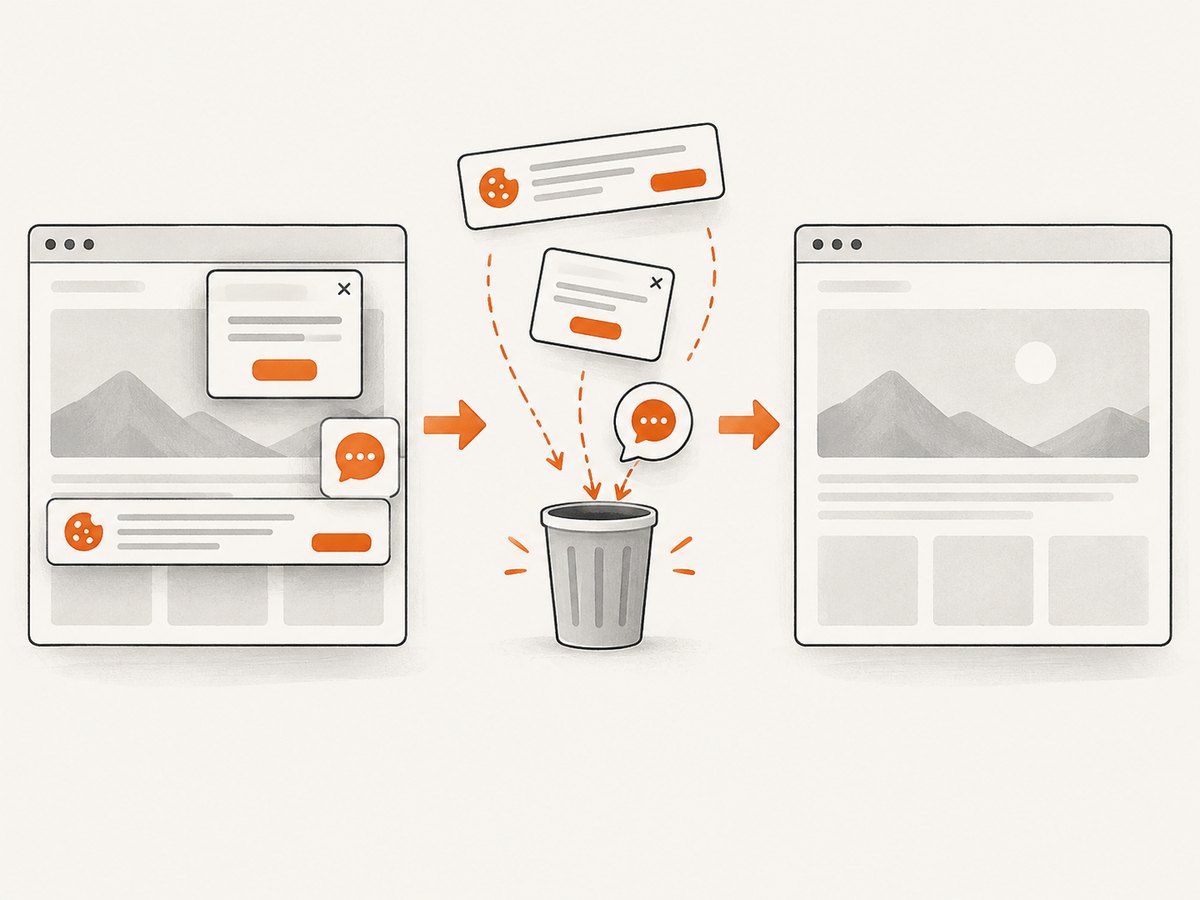
- Reproduce the problem. Keep the input and launch command consistent. A debugger can only reveal the run you are examining.
- Pause before the suspicious line. Place
breakpoint()before a calculation, branch, or call whose result is unexpected. - Check the current values. Use
p nameorpp object. Check types too:p type(value)can expose an unexpected string,None, or container. - Choose the right step. Use
nto stay in the current function,sto enter a call, andrto run until the current function returns. - Compare the result with the assumption. Inspect the next line and any changed values. If the value was already wrong on entry, move up the call stack and inspect the caller.
- Remove or retain the breakpoint deliberately. A committed
breakpoint()can interrupt later runs. Remove it after diagnosis, or replace it with a test or logging that checks the behavior.
You can enter Python expressions and statements at the prompt in the selected frame. This is useful for checking a derived value without editing the file. But statements can mutate the live program: assigning to a local, changing a list, or calling a function with side effects changes the run you are diagnosing. Prefer read-only expressions until you deliberately want to experiment.
3. Set conditional and temporary breakpoints
You do not have to edit source to set a breakpoint. The b command accepts a line number, optionally qualified by a file, or a function name. A condition makes pdb stop only when an expression evaluates as true. A temporary breakpoint removes itself after it stops once.
(Pdb) b 42
(Pdb) b app.py:87, user_id == 1042
(Pdb) tbreak parse_record
(Pdb) break
(Pdb) disable 1
(Pdb) enable 1
(Pdb) clear 2
Use break without arguments to list active breakpoints. The number shown in that list is used by disable, enable, and clear. Conditions should be safe to evaluate in the selected frame; referencing a name that is not defined there can itself raise an error. For repetitive stops, pdb also supports associating debugger commands with a breakpoint, which can save prompt work. Consult help commands for syntax and details.
4. Debug a script without editing it
To start a script under pdb from its first line, use the module command:
python -m pdb path/to/script.pyPass the script’s arguments after its path, as you would when running it normally:
python -m pdb path/to/script.py input.csv --strictFor a module, use pdb’s module form:
python -m pdb -m package.moduleStarting at the first line can be noisy. At the prompt, set a breakpoint at the code of interest and continue, or use the debugger’s stepping and listing commands to move forward. When the program exits abnormally, pdb enters post-mortem debugging automatically so you can examine the exception site and stack.
5. Investigate an exception after it happens
Post-mortem debugging starts with a traceback that already exists. In an interactive Python session, catch the exception and invoke pdb.pm() to inspect the most recent one:
import pdb

try:
    result = parse_record("bad input")
except Exception:
    pdb.pm()
    raise
The raise after pdb.pm() preserves the failure once you quit or continue out of the debugger. Alternatively, pass a traceback explicitly with pdb.post_mortem(tb) when your code has captured one. For example:
import pdb
import traceback

try:
    run_job()
except Exception as exc:
    pdb.post_mortem(exc.__traceback__)
    raise
At the prompt, start with where to see the whole stack. The current frame is marked. Use up and down to select a caller or callee, then inspect that frame’s locals with p name. Follow a bad value backward until you find the first place where the value diverged from expectations. The exception line is where the symptom surfaced; the cause can be earlier.
6. Understand frames and Python version differences
Debugger commands operate in a selected stack frame. where shows the call path, while up and down change the frame used for inspection. The same local variable name can have different values in different frames, so check which function and source line pdb identifies before drawing conclusions.
Python’s current reference documents several version-specific details:
| Python version | What to know |
|---|---|
| 3.7+ | breakpoint() is the standard convenience entry point; it is an alternative to pdb.set_trace(). |
| 3.13+ | pdb.set_trace() enters immediately rather than on the next line. Under PEP 667, assignments made in pdb immediately affect the active scope. |
| 3.14+ | The reference documents attaching to a process by PID with -p/--pid and asynchronous pdb.set_trace_async(). |
For example, where supported, attaching to a local process uses:
python -m pdb -p 12345PID attachment and set_trace_async() are Python 3.14 additions; older interpreters do not necessarily provide them. Check the reference for the exact interpreter you deploy. Async programs can involve multiple tasks and interleaved work, so a pause in one task may not explain the full behavior of the others.
7. When an editor debugger helps: VS Code
Terminal pdb is part of Python and requires no project debugger configuration. It is a direct fit for stepping through a script, examining a live frame, or investigating an exception. VS Code’s Python Debugger extension, which uses debugpy, adds editor breakpoints, a variables view, a debug console, and reusable launch settings. It is useful when seeing source and state together makes a long session easier to follow.
For a basic script, open the file and start the Python File debugging configuration. For project-specific arguments or behavior, save a configuration in .vscode/launch.json. A minimal launch configuration can look like this:
{
  "version": "0.2.0",
  "configurations": [
    {
      "name": "Python: Current File",
      "type": "debugpy",
      "request": "launch",
      "program": "${file}",
      "console": "integratedTerminal",
      "args": ["--verbose"]
    }
  ]
}
Select the appropriate Python interpreter for the project. The exact setup depends on the project and extension version; the official VS Code guide covers launch properties, breakpoints, and configurations. VS Code also documents attaching to an already running process and remote debugging. Those workflows need matching source and connection settings. Keep debug access limited to a trusted local or private environment; do not expose a debug port publicly as a casual default.
| Need | Good starting point |
|---|---|
| Inspect an exception or run a short script | pdb or python -m pdb |
| See variables beside source and use editor controls | VS Code Python Debugger extension |
| Repeat the same launch with arguments and settings | VS Code launch.json |
| Inspect a running or remote process | Attach workflow in the VS Code guide; Python 3.14 also documents pdb PID attachment |
8. Troubleshooting common pdb problems
| Symptom | Likely cause | Fix |
|---|---|---|
breakpoint() does not stop |
The execution path never reaches it, or the active environment changes breakpoint behavior. | Confirm the branch and inputs reach that line. Check PYTHONBREAKPOINT and whether a custom hook is configured. |
NameError at the prompt |
The selected frame does not define that name. | Use where, select the expected frame with up/down, then inspect available values. |
| A breakpoint line is not hit | The line is not executed, the file path differs, or a condition is false. | List breakpoints with b; check the source line and condition, then set a temporary unconditional breakpoint nearby. |
| Stepping skips into library code or seems to run too far | n stays in the current function, while s enters calls; r runs to return. |
Choose the command according to whether you want to enter the call, stay in the current function, or finish it. |
| Debugger changes the outcome | A prompt statement mutated live state or invoked code with side effects. | Restart with the same input and inspect using read-only expressions first. Avoid relying on a mutated run as a reproduction. |
python -m pdb -p is unavailable |
PID attachment is documented as a Python 3.14 feature. | Check python --version; on older versions, use a breakpoint in the program or the editor’s supported attach workflow. |
| VS Code cannot start the intended program | The selected interpreter, working directory, arguments, or launch configuration is wrong. | Check the interpreter and the active launch.json configuration; confirm paths and arguments match a normal run. |
| Remote attach cannot connect | Connection settings, network reachability, or source paths do not match. | Follow the VS Code remote debugging guide, verify both ends’ settings and source mapping, and keep the connection private. |
9. A repeatable debugging checklist
- Record the command, input, environment, and complete traceback that reproduce the problem.
- Find the earliest suspicious boundary instead of starting with arbitrary stepping.
- Inspect both value and type; check the selected frame before trusting a variable.
- Use a conditional breakpoint when a loop or request fails only for a particular case.
- Trace the incorrect value toward its origin through callers and return values.
- Restart after any debugger command that changed state or called side-effecting code.
- Remove temporary source breakpoints and convert the finding into a regression test when appropriate.
10. Or skip the browser setup
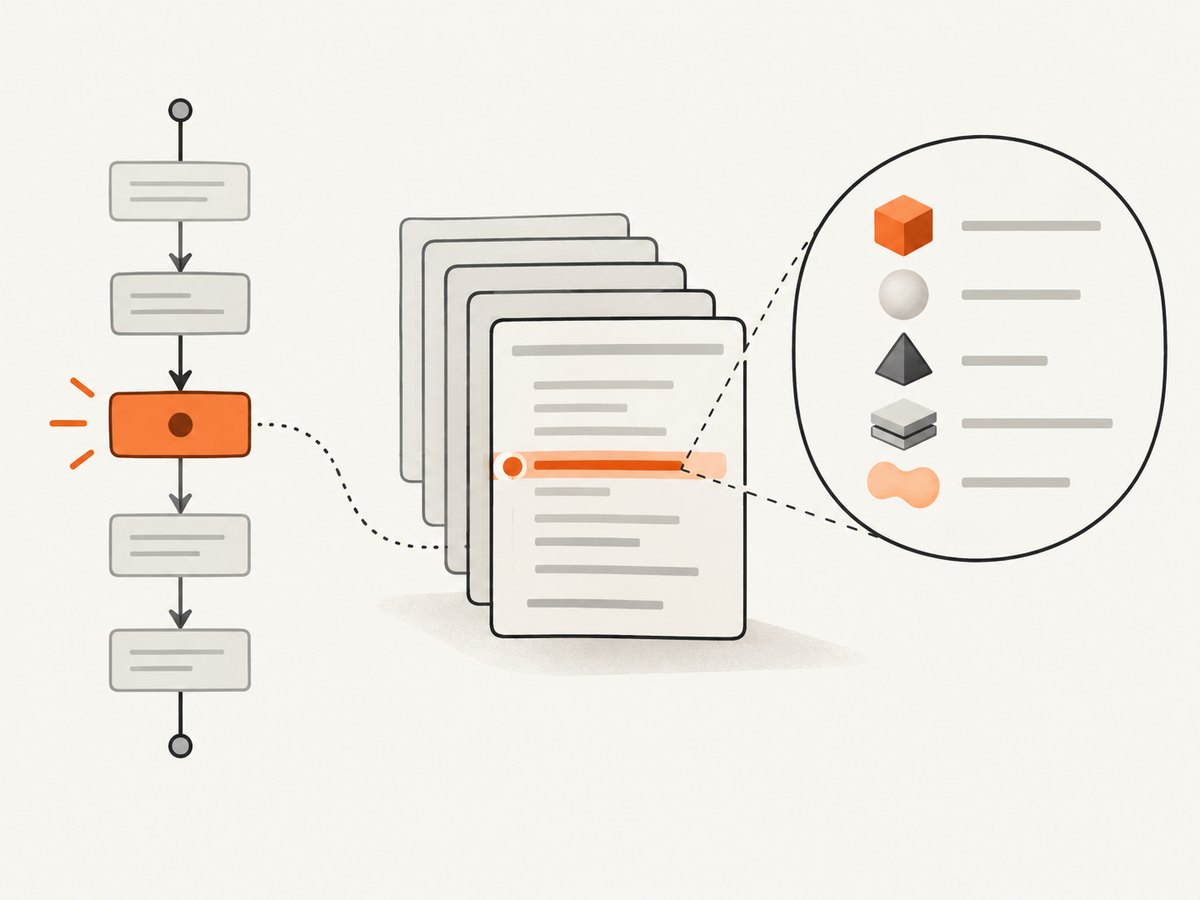
If the debugging job is to inspect how a web page renders, you may not need to set up a browser or automate one locally. ScreenshotNeo is a website screenshot API and MCP server from ScreenshotNeo. Its one-call API returns an image or PDF; see the API documentation for request options.
curl -G "https://api.screenshotneo.com/v1/shot" \
  -d access_key=YOUR_API_KEY \
  --data-urlencode url=https://stripe.com \
  -o shot.webp
The same endpoint can be called from Python:
import requests

r = requests.get(
    "https://api.screenshotneo.com/v1/shot",
    params={"access_key": "YOUR_API_KEY", "url": "https://stripe.com"},
    timeout=90,
)
open("shot.webp", "wb").write(r.content)
Or from Node.js:
const q = new URLSearchParams({
  access_key: 'YOUR_API_KEY',
  url: 'https://stripe.com'
});
const res = await fetch(`https://api.screenshotneo.com/v1/shot?${q}`);
if (!res.ok) throw new Error(`Screenshot request failed: ${res.status}`);
await import('node:fs/promises').then(fs => fs.writeFile('shot.webp', Buffer.from(await res.arrayBuffer())));- Cookie and consent banners are accepted and removed before capture; newsletter popups and chat widgets are also removed. Each step can be turned off.
- Bot checks, blank pages, timeouts, failed loads, and cache hits cost nothing. Response headers identify the page verdict and billing status.
- An MCP server gives AI agents tools to take screenshots, get page information, and capture PDFs.
- The Free plan includes 1,000 screenshots per month with no card; paid plans start at $5 for 3,000.
Sign up free for 1,000 screenshots a month with no card.
11. Performance, reliability, and cost
For local debugging, the main cost is the time spent reproducing and inspecting the run. A breakpoint pauses the program and changes its timing; use the debugger to understand behavior, then verify the fix with a fresh run. Stepping through a tight loop one line at a time can be slow for a person, so use a conditional breakpoint or inspect the state at a narrower boundary.
Debugging can affect timing-sensitive programs. Pausing may alter concurrency, timeouts, or interactions with external systems. A local run with representative inputs is often easier to reason about than attaching to a shared production process. Protect secrets in the debugger: locals and object representations may expose tokens, personal data, or request contents. Avoid sharing traces or screenshots containing sensitive values.
pdb is included with Python, and VS Code’s debugger is an editor extension; neither requires choosing a paid physical product. For browser screenshots instead of Python execution state, ScreenshotNeo lists Free (1,000 shots monthly), Starter ($5 for 3,000), Growth ($15 for 15,000), Pro ($39 for 60,000), Scale ($99 for 250,000), and Business ($249 for 1,000,000); yearly billing gives two months free. Every feature is on every plan. These are screenshot API prices, not debugger costs.
12. Frequently asked questions
Is pdb included with Python?
Yes. It is in the Python standard library, so the command-line debugger does not require installing a separate package.
What is the difference between n and s?
n runs to the next line in the current function. s steps into a function call on the current line.
Can I use pdb with an exception that has already occurred?
Yes. Running a script with python -m pdb enters post-mortem mode after an abnormal exit. In an interactive session, use pdb.pm() or pass a traceback to pdb.post_mortem().
Should I choose pdb or VS Code?
Use pdb for direct terminal inspection and post-mortem work. Use VS Code when the editor’s visual state, controls, and reusable launch settings suit the session. The official guides describe workflow differences, not a benchmark showing one is universally faster.