How to View Console Logs and Errors from Headless Chrome
Inspect a live headless Chrome page with remote DevTools, or capture console messages, JavaScript errors, network failures, and browser logs with Puppeteer.
To inspect a live headless Chrome page, start Chrome with remote debugging enabled and connect from a visible Chrome window at chrome://inspect. To capture output in an automated Puppeteer script, attach console and pageerror listeners before navigation or interaction. Use Puppeteer’s dumpio option for Chrome process output, and inspect network failures and HTTP status codes as separate signals.
These methods answer different questions: DevTools gives you an interactive view of a running target; Puppeteer listeners record page events in Node; process output helps diagnose Chrome itself. The steps below show how to set up each path and distinguish the kinds of errors you may see.
1. Choose the output you need
| What you need to inspect | Use | What it captures |
|---|---|---|
| Explore a live page, sources, and stack traces | Remote debugging and chrome://inspect |
A connected DevTools session, including the Console |
| Save page messages in an automation run | Puppeteer page.on('console') |
Messages emitted through the page’s console |
| Record uncaught JavaScript exceptions | Puppeteer page.on('pageerror') |
Page exceptions as a separate event stream |
| Find out why Chrome will not launch or has crashed | Puppeteer dumpio: true |
Browser-process output forwarded to Node’s standard streams |
| Diagnose failed requests or server responses | requestfailed and response status checks |
Request-level failures and HTTP responses, separately |
A page’s console.log() runs in the browser context. It does not automatically print to Node’s terminal. Likewise, a server response with status 404 is not the same event as a failed network request. Collect the signal that corresponds to the symptom.
2. Inspect a running headless page in Chrome DevTools
Remote DevTools is useful when you want to interact with the current page, click through its state, inspect sources, or follow a stack trace. The headless process does not open its own visible DevTools window: you connect to its debugging target from a separate headful Chrome instance.
Start Chrome with a debugging endpoint
chrome --headless --remote-debugging-port=0 https://developer.chrome.com/Using port 0 asks Chrome to choose a port and print a DevTools WebSocket URL to standard output. Keep the process running while you inspect it. Copy the endpoint’s host and port.
Connect from visible Chrome
- Open a regular Chrome window.
- Go to
chrome://inspect. - Select Configure and enter the address and port from the endpoint printed by headless Chrome.
- Find the running page target and choose Inspect.
- Open the Console panel. Use the page as needed while the session is attached.
Use the Console’s severity filters to narrow output to verbose, info, warning, or error messages. If navigation clears messages you need, enable Preserve Log. For exceptions, inspect the stack trace and source link shown with the error to locate where it originated.
Treat the debugging endpoint as a control surface for the browser. Keep it local or access-controlled in the environment where Chrome runs; do not expose it broadly just to make DevTools reachable. The steps here describe the connection workflow, not a complete remote-access security setup.
3. Capture page console messages and exceptions in Puppeteer
For repeatable automation, forward browser events into your Node process. Register listeners before goto() and before any action likely to produce messages, or early output may be missed.
import puppeteer from 'puppeteer';

const browser = await puppeteer.launch();

try {
  const page = await browser.newPage();

  page.on('console', msg => {
    console.log(`[page console:${msg.type()}]`, msg.text());
  });

  page.on('pageerror', error => {
    console.error('[uncaught page error]', error);
  });

  await page.goto('https://example.com');

  // Trigger the interaction that may produce output here.
  // For example: await page.click('button');
} finally {
  await browser.close();
}
This is an ES module example. In a project that does not already use ES modules, configure Node for ESM or adapt the import to your project’s module system. Install and run Puppeteer according to its current documentation. The code assumes the browser can launch in the current environment.
The console event provides a ConsoleMessage. Its type() identifies the message category, and text() provides its text. Capturing pageerror separately matters: it reports uncaught page exceptions, rather than merely forwarding calls such as console.error(). Attach both listeners when you need both kinds of evidence.
Capture the output that leads to the bug
Navigation may not trigger the failing code. If the error appears after a click, form submission, delayed script, or other interaction, run that action after registering listeners and keep the page alive until it completes. For long-running pages, avoid closing the browser immediately after navigation if the event you need happens later.
For structured logs, add context you control, such as a URL, run identifier, or timestamp, around the forwarded message. Avoid assuming every message is an exception: console output includes ordinary logs and warnings, while pageerror is the separate uncaught-exception stream.
4. Forward Chrome process logs with dumpio
Page event listeners help diagnose code running in the page. They cannot explain every failure to launch Chrome or a browser-process crash. For those cases, forward the browser process logs to Node’s standard streams:
import puppeteer from 'puppeteer';

const browser = await puppeteer.launch({ dumpio: true });

try {
  const page = await browser.newPage();
  page.on('console', msg => console.log(`[page:${msg.type()}]`, msg.text()));
  page.on('pageerror', error => console.error('[page error]', error));
  await page.goto('https://example.com');
} finally {
  await browser.close();
}
dumpio is a launch option for browser-process output. It complements page listeners; it does not replace them. If Chrome fails before a page exists, process output may be the only one of these streams available.
5. Distinguish console errors, request failures, and HTTP errors
“The page failed” can describe several different events. Collect them independently before concluding what broke:
- Console message: Page code wrote a message such as
console.warn()orconsole.error(). It may be informative without being an uncaught exception. - Uncaught page exception: JavaScript threw and the exception was not handled. Listen for
pageerror. - Request failure: A request failed at the request or network layer. Puppeteer’s
requestfailedevent can provide a request whosefailure()may include human-readable text such asnet::ERR_FAILED. Failure text is not guaranteed. - HTTP error response: The server completed a request with a status such as 404 or 503. This is still an HTTP response, not a
requestfailedevent just because the status is an error.
When a page reports missing content, inspect both failed requests and response statuses. A 404 points toward a completed request for a resource the server did not find; a transport failure points toward a request that did not complete successfully. They need different fixes.
6. Options and practical configuration
| Setting or event | Use it when | Keep in mind |
|---|---|---|
--headless |
You want Chrome to run without a visible browser window. | It does not make page console messages appear in Node. |
--remote-debugging-port=0 |
You need to attach DevTools to a live headless target. | Read the selected endpoint from Chrome’s standard output and keep the process running. |
page.on('console') |
You need browser console messages in an automation transcript. | Attach before navigation or the relevant action. |
page.on('pageerror') |
You need uncaught JavaScript exceptions. | It is distinct from ordinary console output. |
page.on('requestfailed') |
You need request-level failure details. | Do not treat HTTP 4xx/5xx responses as request failures automatically. |
dumpio: true |
You need Chrome process logs for launch or crash diagnosis. | It forwards browser logs to Node’s standard streams. |
Use the smallest set of streams that answers the question, then add others if the evidence points elsewhere. For a flaky page load, for example, page console output alone may be insufficient; add request failure and response inspection. For an immediate launch failure, begin with dumpio because no page event handlers may have been created yet.
7. Troubleshooting common problems
| Symptom | Likely cause | What to do |
|---|---|---|
| No page logs appear in Node | Browser and Node are separate contexts, or the listener was attached too late. | Register page.on('console') before goto() and before the action that emits the message. |
| An exception is missing from the transcript | Only console was observed, or the exception happened before listener registration. |
Add a pageerror listener before navigation and reproduce the error. |
| DevTools cannot find the headless target | The headless process exited, the endpoint/port was entered incorrectly, or the target is no longer running. | Keep Chrome alive, copy the selected endpoint from its output, and configure the matching address and port in chrome://inspect. |
| Console clears after navigation | DevTools is not preserving messages across page loads. | Enable Preserve Log before reproducing the navigation. |
A 404 does not trigger requestfailed |
The request completed with an HTTP error status. | Inspect the response status separately from request failures. |
| Browser launch fails but page listeners show nothing | No page was created, so page events cannot report the startup failure. | Launch with dumpio: true and inspect Node’s standard output and error streams. |
request.failure() has no useful message |
Failure text may not be provided. | Record the request URL and surrounding run context, and do not make your diagnosis depend on a guaranteed error string. |
| Output is noisy or hard to scan | All message types are mixed together. | Include msg.type() in the forwarded line, or filter DevTools by severity. |
8. Performance, reliability, and cost
Adding event listeners is usually a lightweight part of a capture script, but the amount of output can grow quickly on pages with verbose logging or repeated errors. Keep handlers concise and avoid doing slow synchronous work for every event. If you persist a large transcript, consider how your own logging pipeline handles volume and retention.
For reliable reproduction, register listeners before the events of interest, keep the browser and page alive long enough for delayed work, and record which URL and action produced the output. A single successful navigation does not prove that later interactions are error-free. Repeat the action that triggers the issue and inspect the relevant event stream.
There is no service charge for using Chrome DevTools or these Puppeteer event handlers beyond the computing resources and any infrastructure your own environment consumes. The browser still has to launch and load the page. When running captures at scale, account for browser process time, memory, and the logging volume your own infrastructure retains; this dossier establishes no universal benchmark or cost per capture.
9. Or skip the browser setup
If your goal is a clean screenshot rather than debugging page JavaScript, ScreenshotNeo returns a screenshot or PDF from one GET request. Its API and MCP server are built for website captures; it does not replace DevTools when you need console stacks or source inspection.
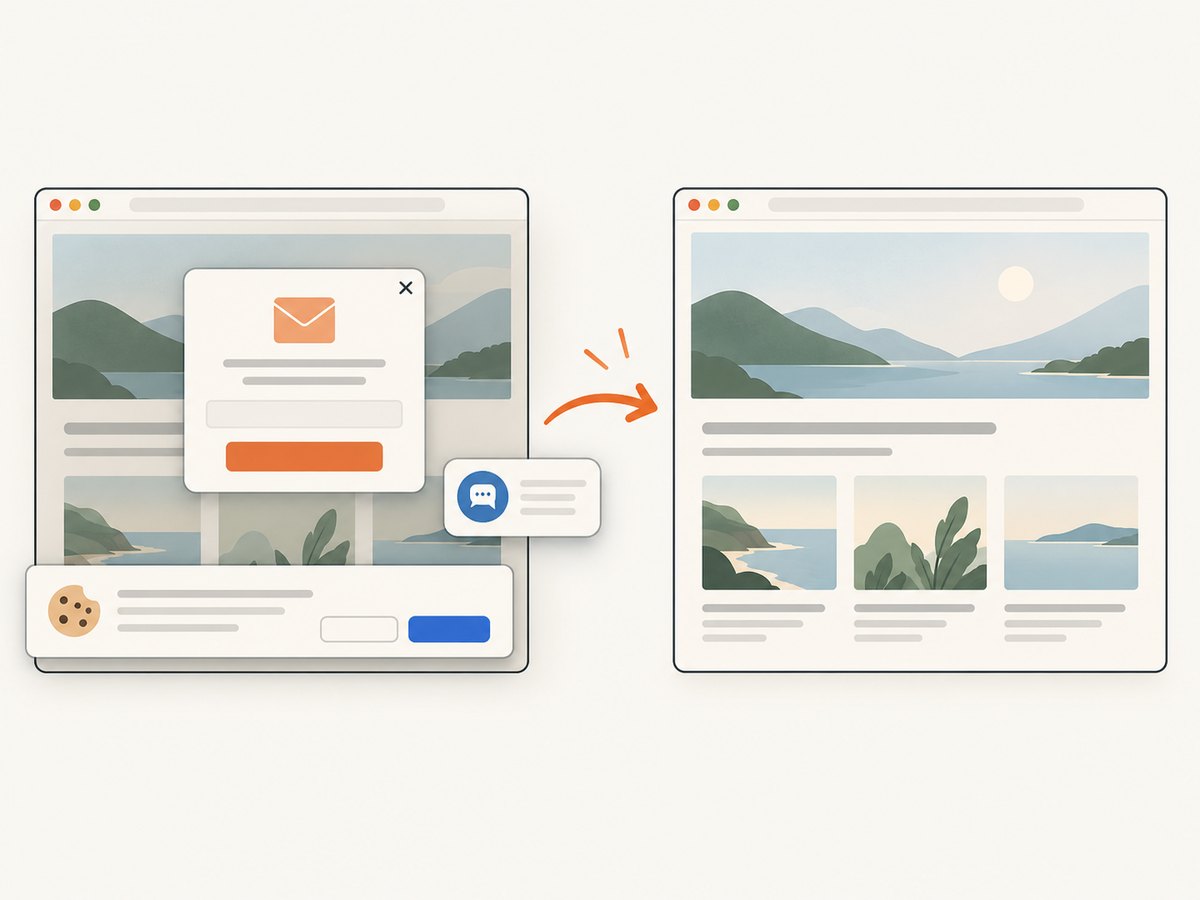
ScreenshotNeo accepts cookie and consent banners before capture and removes more than 60 known consent platforms, newsletter popups, and chat widgets; each step can be turned off. Bot checks, blank pages, failed loads, timeouts, and cache hits cost nothing, and response headers report the page verdict and billing status. An MCP server provides screenshot and PDF tools for AI agents. The free plan includes 1,000 shots per month with no card, and paid plans start at $5 for 3,000 shots.
Example request (replace YOUR_API_KEY with your key):
curl -G "https://api.screenshotneo.com/v1/shot" -d access_key=YOUR_API_KEY --data-urlencode url=https://stripe.com -o shot.webpSee the ScreenshotNeo API documentation for request options. Sign up free for 1,000 screenshots a month, with no card required.
10. FAQ
Can I see headless Chrome’s Console without opening a visible browser?
Yes. Puppeteer can forward page console messages and uncaught exceptions to Node. Remote DevTools is the interactive option and uses a visible Chrome window to inspect the running target.
Does console.error() mean the page threw an exception?
No. It is a console message. Capture pageerror as well if you need uncaught JavaScript exceptions.
Will dumpio show messages from my page?
It forwards browser process logs. Use page event listeners for messages emitted by page JavaScript.
Why do I see a 500 response but no request failure?
An HTTP 500 is a completed response. Check response status codes separately from request-level failures.
Primary documentation
- Chrome Headless mode — remote debugging workflow.
- Puppeteer debugging guide — forwarding page console output.
- Puppeteer PageEvent API — page events including console, page errors, and request failures.
- Puppeteer LaunchOptions API — launch configuration including
dumpio. - Chrome DevTools Console reference — severity filters, Preserve Log, and console inspection.


