How to View HTML from a URL
Learn how to view original HTML, inspect the live DOM, examine network responses, and capture rendered pages from any URL.
To view HTML from a URL, choose the method that matches what you need:
- Original HTML: use View Page Source or
view-source:. - Current rendered DOM: open Developer Tools and use Elements or Inspector.
- Document response, headers, and redirects: use the Network panel.
- Google’s rendered view: use Search Console URL Inspection or the Rich Results Test.
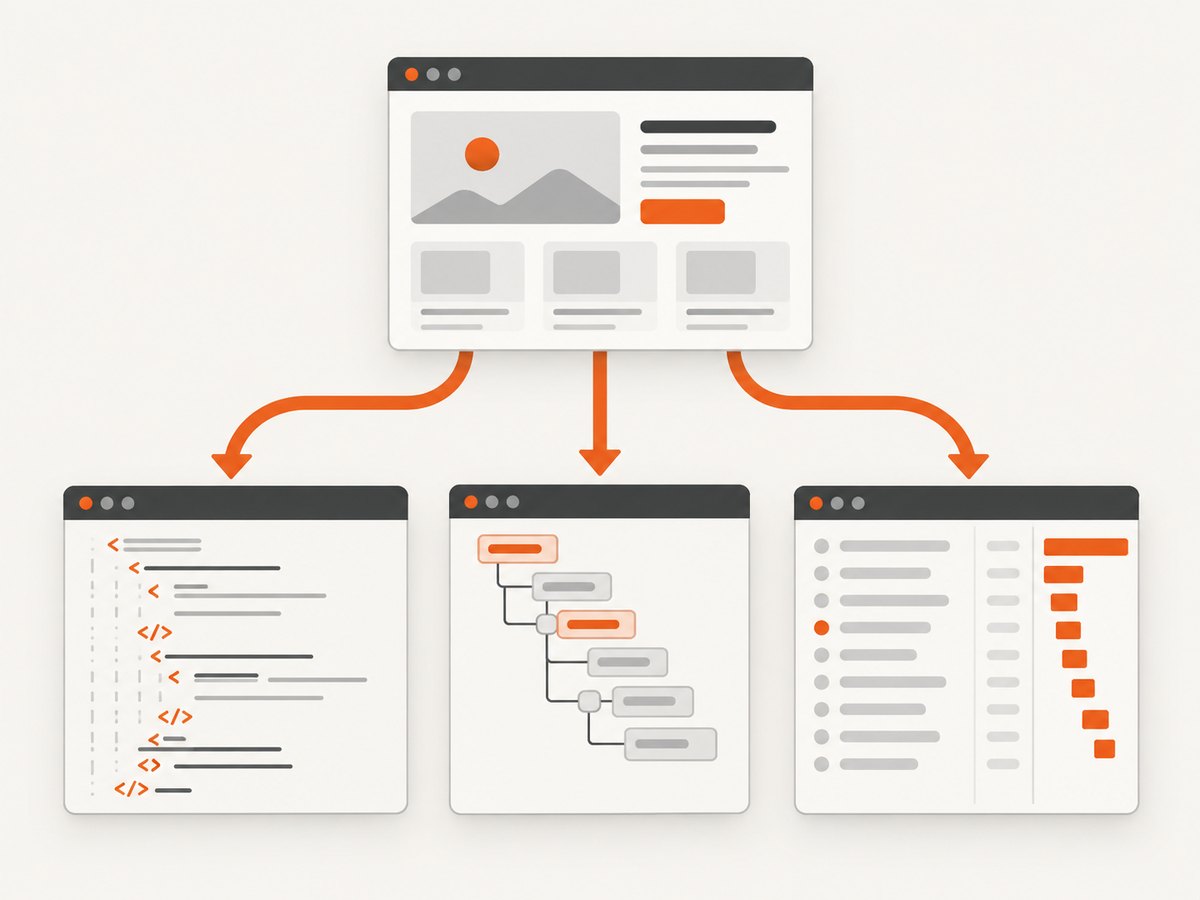
The original source and the live DOM are often different. Source is the HTML returned before scripts run; the DOM is the page after the browser parses HTML and JavaScript changes it.
1. View the original HTML source
Open the URL in a browser, right-click the page, and choose View Page Source. You can also enter this form directly in the address bar:
view-source:https://example.com/pathThis shows the initial document response. It is useful for checking server-rendered markup, title and description tags, canonical links, structured data included in the response, and scripts present before page execution.
It may not include text, products, comments, or other elements inserted later by JavaScript. Google explains that “show source” typically displays the original code returned to the browser before scripts and other resources run (Google Search Console documentation).
Save the source from the command line
curl -L --compressed 'https://example.com/path' -o page.html
sed -n '1,120p' page.html
-L follows redirects and --compressed asks the server for compressed content and decompresses it locally. The result is still the server’s response, not the post-JavaScript DOM.
Fetch source with Python
import requests

url = 'https://example.com/path'
r = requests.get(url, timeout=30)
r.raise_for_status()
print(r.url)
print(r.text[:2000])
with open('page.html', 'w', encoding=r.encoding or 'utf-8') as f:
    f.write(r.text)
Fetch source with Node.js
const res = await fetch('https://example.com/path', { redirect: 'follow' });
if (!res.ok) throw new Error(`${res.status} ${res.statusText}`);
const html = await res.text();
console.log(res.url);
console.log(html.slice(0, 2000));
2. Inspect the live DOM in Developer Tools
Use Elements in Chrome, Edge, and most Chromium browsers, or Inspector in Firefox and Safari. Common shortcuts are Ctrl+Shift+I or F12 on Windows and Linux, and Command+Option+I on macOS.
- Open the page.
- Open Developer Tools.
- Select Elements or Inspector.
- Expand the document tree or press
Ctrl+F/Command+Fto search. - Right-click a node to copy its HTML, selector, or XPath.
The inspector shows what the HTML looks like at runtime and which CSS rules apply to each element (MDN’s Developer Tools guide). Edits made in the panel normally affect only your current browser session.
See which script changed an element
Right-click an element and choose Break on, then select Subtree modifications, Attribute modifications, or Node removal. Reload or repeat the action that changes the page. The debugger pauses at the code that made the mutation.
Copy the current DOM
In Elements/Inspector, right-click the root node and choose Copy → Copy outerHTML (wording varies by browser). This captures the parsed, modified DOM currently visible to the browser, including changes that do not exist in View Source.
3. Inspect the actual document response with Network
- Open Developer Tools and choose Network.
- Enable recording and optionally disable the cache.
- Reload the page.
- Filter by Doc or select the request whose type is document.
- Inspect Headers, Preview, and Response.
The document request reveals the status code, redirects, final URL, response headers, content type, compression, cookies, and the exact HTML returned. Other requests show API responses, JavaScript, CSS, images, fonts, and analytics loaded afterward. Use Sources to browse loaded files and run saved snippets; Chrome documents these capabilities in its DevTools overview.
Why Network and View Source can differ
- A redirect may send the browser to a different final URL.
- Authentication, cookies, language, or user-agent headers can change the response.
- Service workers may serve a cached response.
- The browser may display a decoded or transformed representation.
- JavaScript can fetch data and create DOM nodes after the document response arrives.
4. Use Google’s rendered HTML tools
Search Console URL Inspection
For a site you manage, open URL Inspection in Google Search Console, enter the URL, and request a live test when available. The rendered result can expose an HTML view and helps diagnose what Googlebot could fetch. Ownership and access to the relevant property are required.
Rich Results Test
For a public URL, use Google’s Rich Results Test. The page must be reachable by Google without login and must not be blocked by robots.txt. This is useful for checking rendered structured data and the HTML Google can process; it is not a replacement for inspecting every browser state.
5. Choose the right method
| Method | Shows | Best for | Limitation |
|---|---|---|---|
| View Page Source | Initial HTML response | Static markup, metadata, early scripts | Usually before JavaScript changes |
| Elements/Inspector | Live parsed DOM and CSS | Debugging what users see | May differ from the server response |
| Network document request | Response, headers, redirects | Diagnosing delivery and loading | Requires a reload for a clean capture |
| Sources | Loaded scripts, styles, and assets | Finding code and snippets | Does not explain every runtime mutation alone |
| Search Console/Rich Results Test | Google’s rendered view | SEO and crawlability checks | Requires fetchability; Search Console requires site access |
6. Handle JavaScript-heavy pages
If the content is missing from View Source but visible on screen, it is probably rendered or fetched after load. Inspect the live DOM, then use Network to identify the XHR or Fetch request that supplied the data. Open that response directly when possible.

For repeatable inspection, record the conditions that affect the result:
- Viewport size and device emulation
- Logged-in versus logged-out state
- Cookies, consent choices, and local storage
- Language, timezone, and geolocation
- Ad blockers, extensions, and service workers
- Whether the page was refreshed from cache
7. Common problems and fixes
| Problem | Likely cause | Fix |
|---|---|---|
| View Source lacks visible text | JavaScript inserts it after load | Inspect Elements and identify the data request in Network |
| Elements differs from the downloaded HTML | Scripts, personalization, or hydration changed the DOM | Compare the document response with a DOM copy and check Console/Network |
| The page is blank | Script error, blocked resource, bot check, or failed API request | Check Console errors, document status, failed requests, and response body |
| You cannot open the source | Invalid URL, redirect loop, login requirement, or network failure | Copy the final URL from Network and inspect status and redirects |
| HTML appears as one line | Minified or compressed markup | Use DevTools formatting, a local formatter, or search for tags directly |
| Expected content appears only after clicking | Lazy rendering or interaction-triggered fetch | Perform the action with Network recording, then inspect the new request and DOM |
| Google’s result differs from your browser | Robots rules, user agent, timing, or personalization differ | Use Search Console’s live test and compare fetchability and rendered output |
8. Performance, reliability, and cost considerations
For one-off checks, browser tools are fastest. For automation, direct HTTP fetches are efficient when you need only the original response. They cannot execute JavaScript, wait for lazy content, click controls, or reproduce a user session. A real browser is more complete but consumes more CPU and memory and requires timeouts, retries, isolation, and dependency management.
- Set explicit connect and total timeouts.
- Follow redirects and record the final URL.
- Save status, headers, and a timestamp with each capture.
- Retry transient network failures with bounded exponential backoff.
- Do not treat a successful HTTP status as proof that meaningful content loaded.
- Respect authentication, robots rules, rate limits, and site terms.
9. Or skip the browser setup
ScreenshotNeo provides a website screenshot API and MCP server when you need a rendered visual result instead of manually inspecting a browser.
One GET request returns a PNG, JPEG, WebP, or PDF. The API can wait for a selector, delay, or network idle; load lazy images; capture one CSS-selected element or a full page; run custom CSS and JavaScript; set headers, cookies, user agents, authorization, timezone, and geolocation; block ads, trackers, requests, or resource types; and use device presets, custom viewports, dark mode, retina scale, transparent backgrounds, resizing, caching, signed links, asynchronous jobs, webhooks, bulk capture, and a usage API. PDF captures support paper size, margins, landscape mode, and page ranges. See the ScreenshotNeo documentation for parameter details.
curl -G "https://api.screenshotneo.com/v1/shot" -d access_key=YOUR_API_KEY --data-urlencode url=https://example.com -o shot.webpimport requests
r = requests.get("https://api.screenshotneo.com/v1/shot", params={"access_key": "YOUR_API_KEY", "url": "https://example.com"}, timeout=90)
open("shot.webp", "wb").write(r.content)const q = new URLSearchParams({ access_key: 'YOUR_API_KEY', url: 'https://example.com' });
const res = await fetch(`https://api.screenshotneo.com/v1/shot?${q}`);ScreenshotNeo accepts cookie and consent banners before capture and removes more than 60 known consent platforms, newsletter popups, and chat widgets. Bot checks, blank pages, timeouts, failed loads, and cache hits are not billed; response headers report the page verdict and whether the request was billed (X-Page-Verdict and X-Billed). Its MCP server provides take_screenshot, get_page_info, and capture_pdf for Claude, Cursor, and other MCP clients. The Free plan includes 1,000 screenshots per month with no card; paid plans start at $5 for 3,000. Create a free ScreenshotNeo account.
10. FAQ
Is View Source the same as Inspect Element?
No. View Source shows the initial response; Inspect Element shows the live DOM after parsing and script execution.
How do I view HTML without opening a browser?
Use curl, Python requests, or Node.js fetch for the original response. Use a browser automation tool when JavaScript rendering is required.
Can I see HTML for a page I do not own?
Yes, if the URL is publicly reachable. Private, authenticated, blocked, or paywalled pages require authorized access.
Why does copied HTML not include CSS?
CSS is commonly loaded as separate stylesheets. Inspect the Network panel or Sources to find those files and their URLs.
Which view should I use for SEO?
Compare the original source with the rendered DOM, then use Search Console or the Rich Results Test to check what Google can fetch and render.


