How to View and Render a Headless Selenium Browser Session
Learn how headless Selenium renders pages, inspect Chrome live with DevTools, capture screenshots or PDFs, and fix blank or incorrect output.
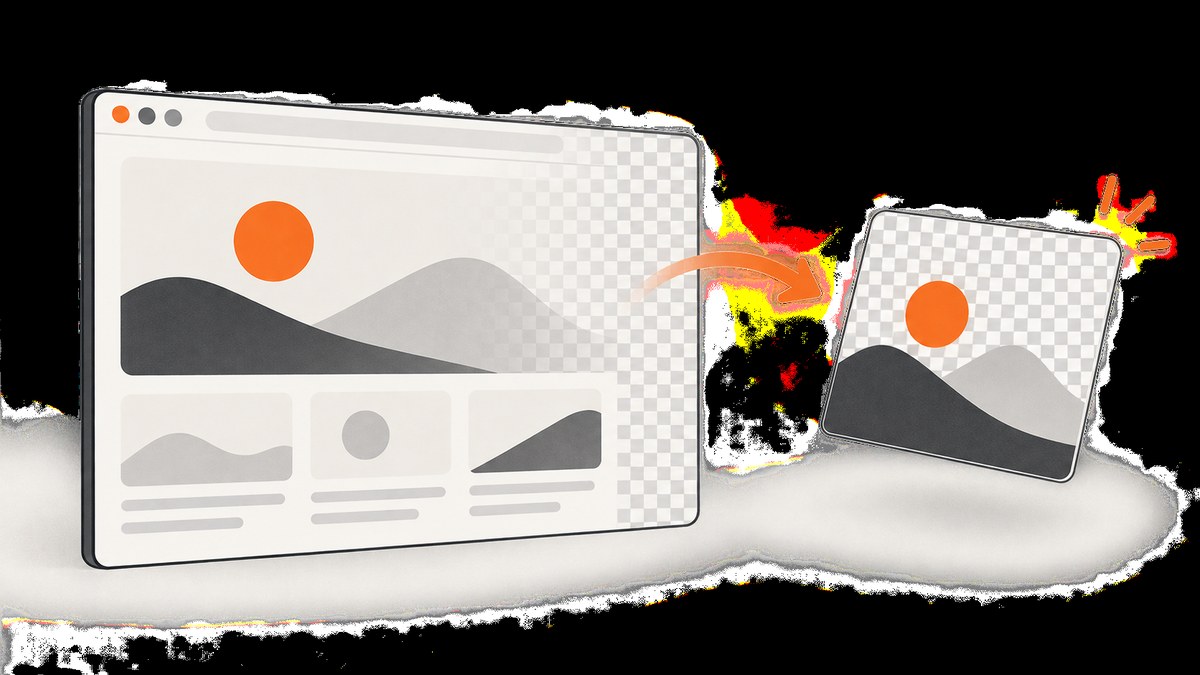
Headless Selenium runs Chrome without displaying its normal desktop window, but the browser still parses HTML, runs JavaScript, lays out pixels, loads resources and exposes the same debugging information as a visible session. To see what it is rendering, start Chrome with remote debugging enabled and attach a regular Chrome window through chrome://inspect. To create a durable result, save a screenshot, print a PDF or serialize the post-script DOM.
This guide shows the complete workflow in Python, explains the equivalent Chrome command-line tools, covers timing and dynamic content, and gives a troubleshooting checklist for blank pages, mismatched drivers and incorrect layouts.
What “headless” means
Chrome’s new headless mode creates a browser instance but does not display platform windows. The rendering engine still performs navigation, style calculation, painting, JavaScript execution and network requests. Selenium controls that instance through WebDriver. The --headless=new flag selects the current headless implementation; use an explicit viewport so your output is repeatable.
Headless mode is different from downloading HTML. A page can change its DOM after scripts run, request data from APIs, load images lazily and apply media-query rules based on the viewport. A capture taken before those operations finish can be technically successful while still being visually incomplete.
Choose the artifact you need
| Artifact | Best for | What it contains |
|---|---|---|
| PNG screenshot | Pixel-level visual checks, regression fixtures, documentation | The rendered viewport as pixels |
| Reports and print-oriented output | Chrome’s print layout, pagination and page styling | |
| Serialized DOM | Checking what scripts produced | Post-script HTML returned by the browser, not the original response |
| Live DevTools target | Interactive debugging | A view into the running page, including console, network, DOM and styles |
A screenshot cannot explain why an element is missing; the DOM and console can. A DOM dump cannot prove that fonts or composited layers look correct; pixels can. Save the artifact that answers the question you are investigating.
Install Selenium and a compatible Chrome
Install the Python package and ensure Chrome is installed on the machine that will run the test:
python -m pip install -U seleniumModern Selenium can manage drivers automatically, but Chrome and ChromeDriver still need compatible major versions. Check the Selenium Chrome documentation when a session fails during startup. In a container or CI runner, verify that the Chrome binary is present and executable.
Render and save a screenshot with Selenium
The following is a complete runnable example. It selects headless mode, fixes a 1440×1000 viewport, waits for a visible page heading, saves pixels and writes the serialized DOM for inspection.
from selenium import webdriver
from selenium.webdriver.chrome.options import Options
from selenium.webdriver.common.by import By
from selenium.webdriver.support.ui import WebDriverWait
from selenium.webdriver.support import expected_conditions as EC

options = Options()
options.add_argument("--headless=new")
options.add_argument("--window-size=1440,1000")
# Add this when you need a live DevTools target; see the next section.
# options.add_argument("--remote-debugging-port=0")

driver = webdriver.Chrome(options=options)
try:
    driver.get("https://example.com")
    WebDriverWait(driver, 20).until(
        EC.visibility_of_element_located((By.TAG_NAME, "h1"))
    )
    driver.save_screenshot("render.png")
    with open("render-dom.html", "w", encoding="utf-8") as f:
        f.write(driver.page_source)
finally:
    driver.quit()
The save_screenshot call captures the current viewport. It does not automatically wait for every image, animation or API request. Choose a readiness condition that belongs to your page, such as a dashboard root becoming visible or a loading spinner disappearing.
Full-page and element captures
For a single element, locate it and use Selenium’s element screenshot method:
hero = driver.find_element(By.CSS_SELECTOR, "main .hero")
hero.screenshot("hero.png")
Viewport screenshots are usually the most portable. Very tall pages may require a full-page facility supplied by the browser or a stitching strategy; test the result because fixed headers, sticky elements and lazy loading can produce repeated or missing regions.
Watch a running headless session live
When pixels are wrong, an interactive view is often faster than adding print statements. Start Chrome with a remote debugging endpoint. Port 0 asks Chrome to select an available ephemeral port:
options.add_argument("--headless=new")
options.add_argument("--remote-debugging-port=0")
Chrome writes a DevTools WebSocket endpoint to its startup output. The endpoint includes a host and port, for example ws://127.0.0.1:<port>/devtools/browser/.... Keep the process running while you inspect it.
- Open a separate, visible Chrome window.
- Navigate to
chrome://inspect. - Choose Configure… and enter the host and port from the endpoint.
- Find the remote target and select Inspect.
Chrome DevTools then provides a live view of the headless page plus Elements, Console, Network, Sources and performance panels. The Chrome remote debugging documentation describes this inspection workflow.
Treat the debugging endpoint as a control interface. Bind it to a protected interface, avoid exposing it to an untrusted network and prefer an ephemeral port for local diagnostics. Stop the process when finished.
Capture a PDF from headless Chrome
For command-line captures, Chrome supports --print-to-pdf. This is useful when you need Chrome’s print layout rather than a viewport image:
google-chrome \
  --headless=new \
  --disable-gpu \
  --print-to-pdf=report.pdf \
  --no-pdf-header-footer \
  https://example.com
The exact executable name varies by operating system. --no-pdf-header-footer removes generated date, URL and page-number decorations where supported. For Selenium-controlled PDF output, use Chrome DevTools Protocol’s print-to-PDF command through your Selenium binding, then write the returned base64 data to a file. Set paper size, margins and landscape options there when your report needs controlled pagination.
Use Chrome’s DOM dump when structure matters
Chrome’s --dump-dom prints the serialized DOM after parsing and script execution:
google-chrome --headless=new --dump-dom https://example.com > page.htmlThis output can differ substantially from the original HTML response. It is useful for confirming that a client-rendered component exists, that an API response populated a table or that a cookie dialog was removed by script. It does not tell you whether the resulting pixels are clipped, hidden behind another layer or rendered with a missing font.
Wait for asynchronous rendering
driver.get() normally returns after navigation reaches its WebDriver page-load condition, not after every application request completes. Use a condition-based wait whenever possible:
WebDriverWait(driver, 30).until(
    EC.presence_of_element_located((By.CSS_SELECTOR, "[data-ready='true']"))
)
WebDriverWait(driver, 10).until(
    EC.invisibility_of_element_located((By.CSS_SELECTOR, ".loading"))
)
driver.save_screenshot("ready.png")
A fixed delay is a fallback when the application has no reliable readiness signal:
import time

driver.get("https://example.com/dashboard")
time.sleep(3)
driver.save_screenshot("after-delay.png")
At the Chrome command line, --timeout=<milliseconds> delays capture. --virtual-time-budget=<milliseconds> advances browser virtual time for time-dependent scripts where that behavior is appropriate. Neither option replaces a page-specific readiness check when data arrives over an unpredictable network.
Make output reproducible
- Set
--window-size=WIDTH,HEIGHT; responsive breakpoints depend on viewport dimensions. - Set the device scale factor when you need consistent retina-like pixels.
- Use a fixed timezone, locale and user agent if the application changes content by region or language.
- Wait for fonts and images before capture. A visible element is not proof that its web font has finished loading.
- Disable or freeze animations when comparing screenshots. Custom CSS can set animation duration to zero.
- Record the URL, viewport, browser version and wait condition next to each artifact.
Debug blank or incorrect pages
| Symptom | Likely cause | Fix |
|---|---|---|
| Session will not start | Chrome and ChromeDriver major versions differ | Install compatible versions and consult Selenium’s Chrome setup guide. |
| Screenshot is all white | Navigation failed, the page is still loading, or content requires a later API response | Check driver.current_url, browser logs and network activity; wait for the page’s real readiness element. |
| Only the shell appears | Single-page application data has not arrived | Wait for a populated selector or a loading indicator to disappear; inspect Console and Network in DevTools. |
| Images are missing | Lazy loading is tied to scrolling, resources failed, or capture happened too early | Scroll the page, wait for image completion, and inspect failed requests. |
| Layout differs from a local window | Different viewport, device scale, media query, font or user agent | Set these values explicitly and compare computed styles in DevTools. |
| Content is blocked | Authentication, bot checks, CSP or an unavailable service | Use test credentials and permitted headers, inspect response status, and capture the failure DOM for diagnosis. |
| Remote inspection cannot connect | Wrong port, browser exited, or endpoint is not reachable from the visible Chrome host | Keep the process alive, copy the printed host/port exactly and configure the same endpoint in chrome://inspect. |
Always save both a screenshot and serialized DOM at the failure point. The pair distinguishes a rendering problem from a data or navigation problem. If you run Selenium remotely, remember that WebDriver may control a browser on another machine; the DevTools endpoint must be reachable from the machine where you open the inspection window.
Performance, reliability and cost considerations
Headless Chrome still consumes CPU, memory, network bandwidth and a complete browser process. Reuse a driver for related captures when isolation is not required, avoid unnecessary tabs, and block third-party resources that are irrelevant to the page under test. Keep explicit timeouts so a stalled request cannot occupy a worker indefinitely. For CI, retain failed screenshots, DOM dumps and browser logs as build artifacts.
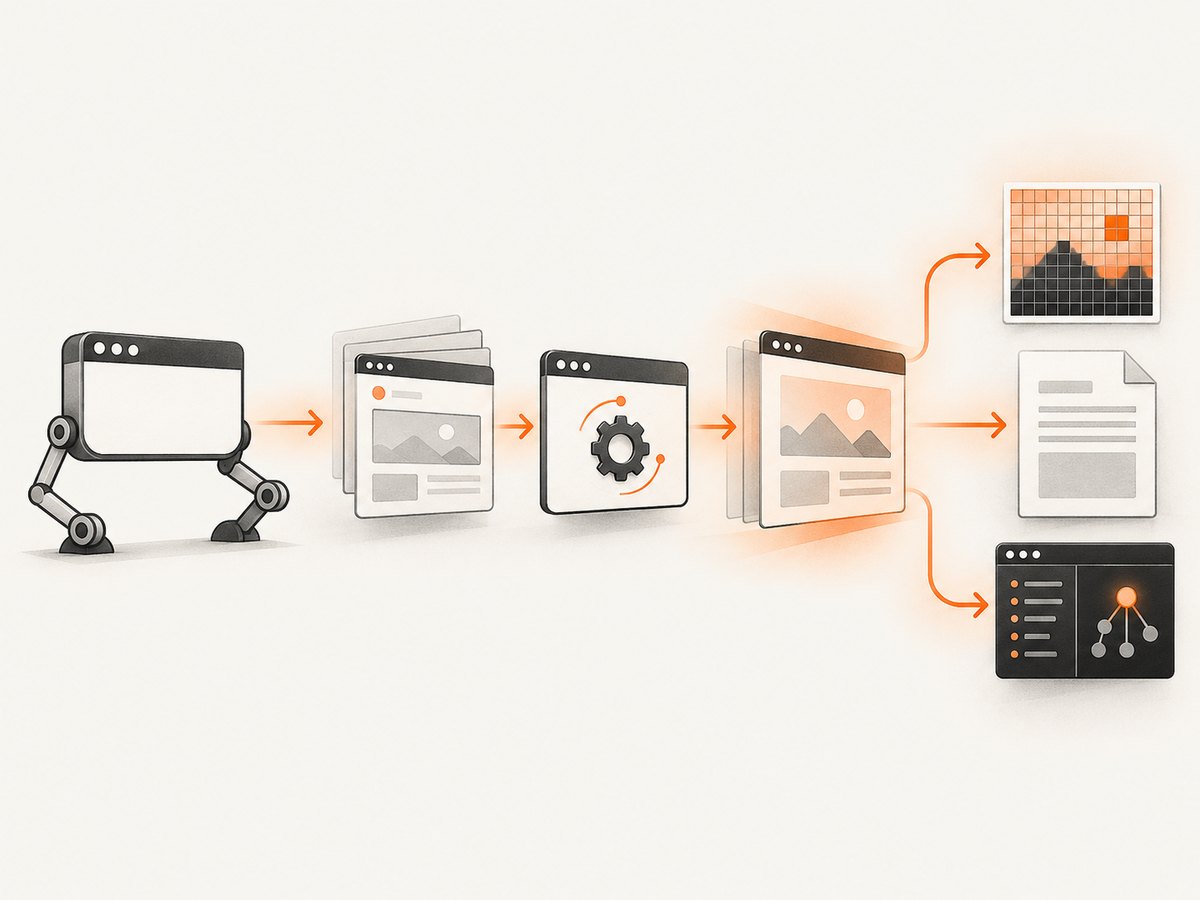
Condition-based waits usually finish sooner and fail more clearly than a large fixed sleep. Fixed viewports and deterministic test data reduce visual diff noise. Remote WebDriver is useful when browsers run in a container or grid, but adds network and version-management failure modes.
If maintaining Chrome, drivers, fonts, sandbox settings and worker capacity is more operational work than your project needs, an API can provide the capture layer.
Or skip the browser setup
ScreenshotNeo provides a website screenshot API and MCP server. One GET request returns PNG, JPEG, WebP or PDF, while its capture flow accepts consent banners and removes more than 60 known consent platforms, newsletter popups and chat widgets before the shot. Each step can be turned off.
Only clean shots are billed. Bot checks, CAPTCHAs, blank pages, timeouts, failed loads and cache hits cost nothing, and the response reports the result through X-Page-Verdict and X-Billed headers. Its MCP server exposes take_screenshot, get_page_info and capture_pdf for Claude, Cursor and other MCP clients.
See the ScreenshotNeo API documentation for authentication and all options. A minimal request is:
curl -G "https://api.screenshotneo.com/v1/shot" -d access_key=YOUR_API_KEY --data-urlencode url=https://stripe.com -o shot.webpimport requests
r = requests.get("https://api.screenshotneo.com/v1/shot", params={"access_key": "YOUR_API_KEY", "url": "https://stripe.com"}, timeout=90)
r.raise_for_status()
open("shot.webp", "wb").write(r.content)const q = new URLSearchParams({ access_key: 'YOUR_API_KEY', url: 'https://stripe.com' });
const res = await fetch(`https://api.screenshotneo.com/v1/shot?${q}`);
if (!res.ok) throw new Error(`HTTP ${res.status}`);
require('fs').writeFileSync('shot.webp', Buffer.from(await res.arrayBuffer()));Options cover full-page captures with lazy images loaded, CSS-element captures, dark mode, 12 device presets or custom viewports, retina scale, PDF paper size and page ranges, custom CSS and JavaScript, clicks, selector waits, delays, network-idle waits, resource blocking, headers, cookies, user agents, Authorization, timezone, geolocation, transparent backgrounds, resizing, TTL caching, signed image links, asynchronous jobs with signed webhooks, bulk capture for 100 URLs per call, usage reporting and an OpenAPI specification. Common parameter names from other screenshot APIs also work when switching.
Plans include 1,000 free shots per month with no card; paid plans start at $5 for 3,000 shots. Create a free ScreenshotNeo account to try it.
Short FAQ
Can I use headless Chrome without Selenium?
Yes. Chrome’s command-line flags can save screenshots, PDFs and DOM dumps directly. Selenium is preferable when you need programmatic waits, element interaction, cookies or assertions.
Does a screenshot contain the DOM?
No. A screenshot contains pixels. Save driver.page_source or use --dump-dom when you need serialized structure.
Why does a live view show a different size?
DevTools may display the target at a scaled size. Compare the browser’s configured viewport and device scale factor with the screenshot’s pixel dimensions.
Should I use a fixed delay or an explicit wait?
Use an explicit wait tied to application readiness. A fixed delay is useful only when no reliable condition exists.
Is the DevTools endpoint an artifact?
No. It is a live control and inspection channel. Save PNG, PDF or DOM output when you need a result that can be reviewed later.


