Web-Based Monitoring Tools: How to Choose the Right Coverage
Learn how uptime checks, synthetic journeys, real-user monitoring, and observability catch different website problems—and how to choose coverage that fits your team.

Web-based monitoring tools are hosted services that check whether a site is reachable, exercise important user journeys, measure real visitor experience, or connect frontend symptoms to backend signals. These are different jobs: a successful HTTP response does not prove that checkout works, and a synthetic test cannot tell you exactly what every real visitor experienced.
Start with the failure you need to detect. Add basic availability checks for outages, scripted synthetic checks for broken paths, real-user monitoring (RUM) for visitor experience, and broader observability when you need to trace a frontend symptom into backend logs, metrics, or traces. Teams can combine layers; they do not need to buy every capability on day one.
1. What web-based monitoring covers
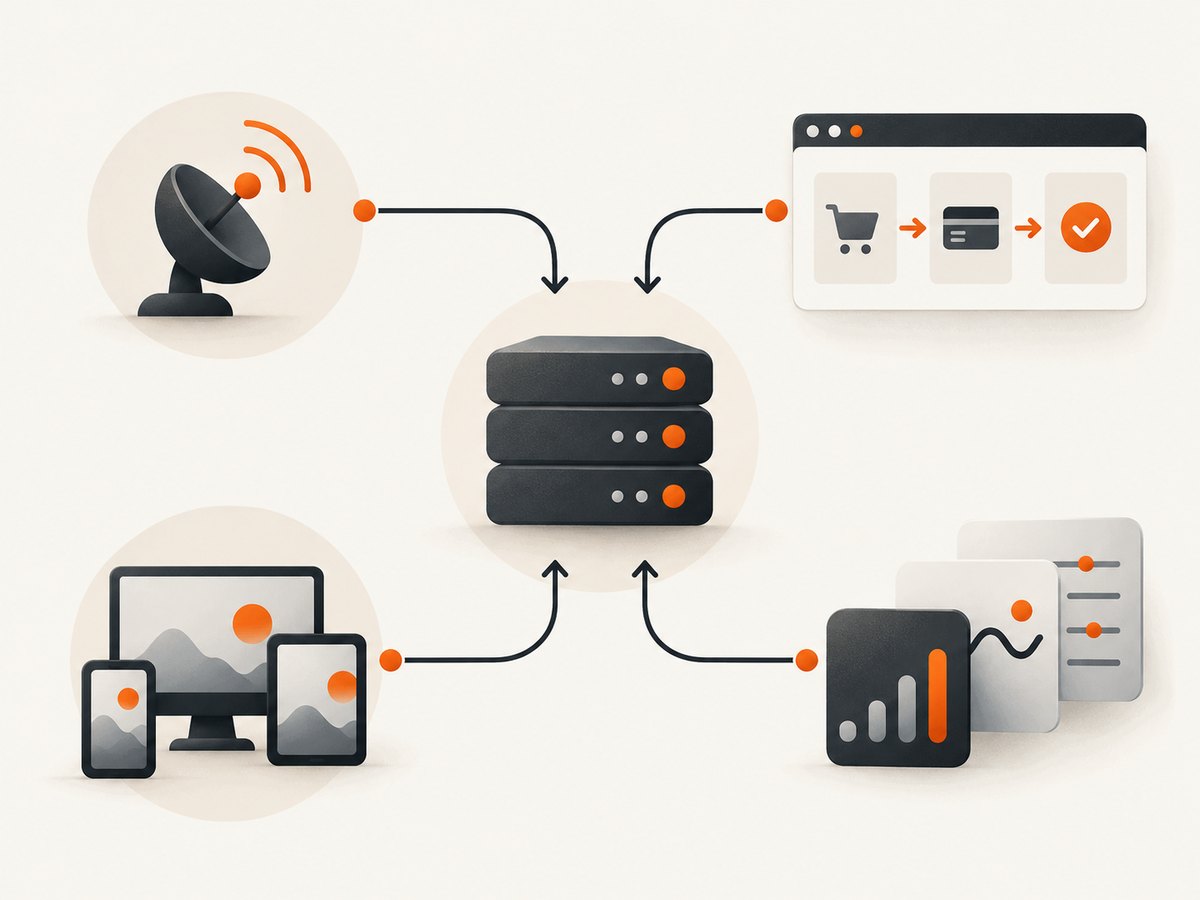
“Website monitoring” is an umbrella term. A monitoring service usually runs checks from a hosted platform and reports measurements or alerts. The useful question is not whether a vendor calls its product website monitoring, but what it observes, how it detects failure, and what happens after an alert.
| Layer | Question it answers | Best fit |
|---|---|---|
| Availability / uptime | Can a check location reach the endpoint and get an expected response? | Outages, DNS or TLS failures, and response-code changes. |
| Synthetic monitoring | Can a planned check or browser script complete a defined path? | Broken pages, forms, login flows, and transaction regressions. |
| Real-user monitoring (RUM) | What performance and errors did actual visitors encounter? | Browser, device, geography, and experience differences in production. |
| Digital experience monitoring / observability | Can frontend symptoms be connected with wider application signals? | Teams investigating across frontend, services, infrastructure, and telemetry. |
These layers complement one another. Pingdom describes availability checks alongside synthetic and real-user monitoring. Grafana describes frontend observability and synthetic monitoring in a broader observability context. These are vendor descriptions of their offerings, not independent comparative test results. Pingdom · Grafana Cloud Frontend Observability
2. Choose the layer that matches the failure
Reachability failures: use availability checks
An uptime check is a small, repeated request to an endpoint. It can identify when a service cannot be reached or returns an unexpected response. Compare check interval, locations, supported protocols, alert routing, and false-positive handling. A response-code check is useful for a simple public page or health endpoint, but it does not establish that page content rendered correctly or that a user can complete a transaction.
Decide what “up” means for each endpoint. A homepage may return a cached page while an API is unavailable. Conversely, a maintenance page might return a successful status even though the application is unusable. Specify expected status codes or response content when the service supports it, and monitor critical dependencies separately where practical.
Broken or slow workflows: use synthetic checks
Synthetic monitoring runs planned checks on a schedule. These can be simple requests or browser-driven journeys, depending on the platform. For a browser journey, define the meaningful user actions and assertions: open the sign-in page, submit a test account, reach the expected destination, and confirm a visible success condition. A test that only clicks buttons can pass while the underlying operation fails.
Compare browser or protocol support, supported journey complexity, check locations and frequency, secret handling, and the detail included in failure reports. Keep test accounts safe and isolated from real customer data. Avoid destructive actions such as placing real orders unless the workflow is explicitly designed to clean up after itself.
Real visitor experience: use RUM
RUM collects telemetry from actual browser sessions. Vendor-described capabilities include performance metrics, errors, and segmentation by browser, device, or other context. It helps answer questions that a fixed test cannot: whether a slowdown affects one browser family, a particular release, or visitors on a certain device. Grafana describes collecting frontend telemetry with its Faro Web SDK and correlating frontend signals with backend data. Grafana Frontend Observability documentation
Check how the service samples sessions, which metrics and errors it collects, how long it retains data, and what privacy controls are available. Confirm whether the collection method fits your consent, privacy, and data-governance requirements. RUM reflects observed traffic; it cannot report on an audience or journey that has not generated data.
Cross-layer incidents: use observability
When a frontend error may come from a backend dependency, correlating browser events with logs, metrics, and traces can shorten investigation. Grafana describes combining frontend observability and synthetic monitoring with backend telemetry. The practical selection questions are whether the signals share useful identifiers, fit the existing stack, and route actionable alerts to the people who can fix them.
Broader suites may include response time, DNS resolution, SSL health, Core Web Vitals, transactions, and third-party services. Site24x7’s comparison page describes several monitor types and their intended uses; treat this as vendor-published product information, not an independent ranking. Site24x7 website monitoring comparison
3. Compare tools against your workflow
Write down the checks and response process you need before comparing brands. Ask vendors to demonstrate your actual path and alert flow; the available research does not provide independent, apples-to-apples test results. Relevant offerings surfaced in the research include Pingdom, Grafana Cloud, and Site24x7. Feature packaging, locations, pricing, and plan limits can change, so check current vendor documentation and plans before buying.
| Need | What to verify | Example surfaced by research |
|---|---|---|
| Simple external availability | Locations, interval, alert routing, expected-response rules, rechecks | Pingdom describes uptime monitoring and other monitoring layers. |
| Scripted paths and browser checks | Journey support, browser execution, failure evidence, secrets, geography | Pingdom and Site24x7 describe synthetic or transaction monitoring. |
| Visitor performance and errors | Browser/device segmentation, sampling, privacy controls, metrics | Grafana describes frontend observability and RUM. |
| Unified application investigation | Correlation with logs, metrics, traces, alert integrations, operating complexity | Grafana describes connecting frontend and backend telemetry. |
Site24x7 vendor material also describes broad monitoring coverage, but the research notes that some cited collateral is older and that feature numbers should be rechecked. A Site24x7 comparison article lists additional vendors, but because it is vendor-published it is a lead list rather than an independent verdict. Avoid treating any vendor’s “best” claim as a neutral finding.
4. Set up monitoring in practical steps
- List user-critical services. Include the public site, API endpoints, sign-in, and revenue-critical journeys. Assign an owner for each alert.
- Define success explicitly. Specify expected status, content, page state, or transaction result. Decide which slowdowns matter and at what point the team should act.
- Start with an external check. Monitor a lightweight endpoint and a real user-facing URL. Select locations relevant to your users and review current service limits.
- Add a synthetic journey. Exercise a small number of high-value workflows with safe test data. Make assertions about the final state, not just the clicks.
- Add RUM where it answers an open question. Instrument the application if you need production browser performance, errors, or audience segmentation. Review data collection and privacy settings.
- Route and rehearse alerts. Send actionable alerts to a staffed channel. Include the failed check, time, location, and relevant evidence. Test escalation and recovery notifications.
- Review noise and gaps. After deployment, inspect false alarms, stale checks, missed failure modes, and whether the alert led to a useful diagnosis. Adjust thresholds and ownership.
5. Browser screenshots as a visual check
Monitoring tools answer operational questions; a screenshot is a visual artifact useful for reviewing a page state, comparing a rendered result, or attaching evidence to a workflow. Screenshot capture alone is not uptime monitoring: it does not continuously alert on outages or prove a transaction succeeded. For repeatable visual checks, capture the same URL, viewport, and page state consistently, and pair the image with assertions or monitoring signals when correctness matters.

For a do-it-yourself capture, a headless browser such as Playwright can navigate to a page and save a screenshot. Install it in a Node.js project with npm install playwright, then install a browser using npx playwright install chromium.
// save as capture.mjs; run with: node capture.mjs
import { chromium } from 'playwright';

const browser = await chromium.launch({ headless: true });
const page = await browser.newPage({ viewport: { width: 1440, height: 900 } });
try {
  await page.goto('https://example.com', { waitUntil: 'networkidle', timeout: 60000 });
  await page.screenshot({ path: 'page.png', fullPage: true });
} finally {
  await browser.close();
}
Replace the URL with a page you are authorized to capture. `networkidle` can be unsuitable for pages with long-lived connections or continuous background traffic; use `domcontentloaded` or `load`, then wait for a specific selector or a bounded delay that represents the state you need. Prefer a selector assertion for a known page state over an arbitrary sleep. A full-page screenshot may be large, and lazy-loaded content may need scrolling or application-specific waits.
6. Or skip the browser setup
ScreenshotNeo is a website screenshot API and MCP server. Its one-call API accepts a URL and returns an image or PDF. The API documentation describes the parameters; examples below use the supplied endpoint and request pattern.
curl -G "https://api.screenshotneo.com/v1/shot" -d access_key=YOUR_API_KEY --data-urlencode url=https://stripe.com -o shot.webpimport requests
r = requests.get("https://api.screenshotneo.com/v1/shot", params={"access_key": "YOUR_API_KEY", "url": "https://stripe.com"}, timeout=90)
open("shot.webp", "wb").write(r.content)const q = new URLSearchParams({ access_key: 'YOUR_API_KEY', url: 'https://stripe.com' });
const res = await fetch(`https://api.screenshotneo.com/v1/shot?${q}`);
if (!res.ok) throw new Error(`Screenshot request failed: ${res.status}`);
await Bun.write('shot.webp', res);Cookie banners, popups, and chat widgets are removed before the shot. Bot checks, blank pages, and failed loads are never billed; response headers identify the page verdict and billing status. An MCP server lets AI agents use screenshot tools. The free plan includes 1,000 screenshots a month with no card, and paid plans start at $5 for 3,000. This is for screenshot capture, not a replacement for scheduled uptime checks, synthetic transaction alerts, or RUM.
Create a free ScreenshotNeo account to get 1,000 screenshots a month with no card.
7. Troubleshooting common monitoring failures
| Symptom | Likely cause | What to do |
|---|---|---|
| False downtime alert | Transient network issue, one failing location, or a short-lived origin problem. | Review recheck and location behavior, compare the alert with application logs, and choose a suitable confirmation policy. |
| Check passes while users report failure | The test checks only an endpoint or status code; a key workflow or frontend state is broken. | Add a browser journey with a meaningful success assertion and use RUM to inspect actual browser errors. |
| Synthetic login fails repeatedly | Expired test credentials, changed selectors, MFA, bot protection, or a changed flow. | Use a dedicated test account, maintain selectors, and confirm the platform supports the required authentication flow. Do not weaken production security to make a monitor pass. |
| Browser check times out | Page never reaches the selected load condition, a third-party request hangs, or the timeout is too short. | Wait for a relevant selector or stable state; inspect slow dependencies and choose a bounded timeout appropriate to the journey. |
| RUM has little or no data | SDK is not loading, traffic is sampled, consent blocks collection, or the monitored page receives little traffic. | Check installation and collection settings, verify consent behavior, and inspect sample coverage before drawing conclusions. |
| Alerts arrive but are not acted on | Routing, ownership, or alert detail is unclear; thresholds create noise. | Assign an owner and escalation path, include diagnostic context, and tune checks against impact and repeated observations. |
8. Performance, reliability, and cost
Monitoring adds requests and, for browser journeys, can consume more execution resources than simple checks. Keep the monitored set focused on meaningful endpoints and journeys. Avoid overly frequent checks without a reason, and ensure test traffic will not trigger real emails, payments, or irreversible data changes. A monitoring service’s perspective also differs from a visitor’s network and device; multiple locations and RUM can reveal different failure classes.
Reliability depends on the check definition and alert path as well as the vendor service. Make a check resilient to harmless content changes, but specific enough to catch user-visible breakage. Keep credentials scoped and rotate them under your normal security process. Define what should happen when the monitoring provider itself is unavailable or an alert integration fails.
Cost comparisons require current plan details. Check whether pricing depends on monitors, check frequency, browser runs, locations, events, sampled sessions, data retention, or add-on products. Broad suites can reduce tool switching but may add setup and operational complexity. The research did not establish independent prices or comparable tests for the named vendors, so verify current terms directly before selecting a plan.
9. A short selection checklist
- Which concrete failure should be detected first: reachability, a broken journey, visitor experience, or a cross-layer incident?
- Which URLs and workflows are critical, and who responds to each alert?
- Do checks need browser rendering, particular geographies, or authenticated access?
- What evidence does a failed check provide, and can responders diagnose it quickly?
- Does RUM meet your privacy, sampling, retention, and data-control needs?
- Can the service route alerts and connect with the telemetry your team already uses?
- Have you checked current limits and total cost for the coverage you need?
10. FAQ
Is website monitoring the same as uptime monitoring?
No. Uptime is one layer. Synthetic journeys, RUM, and broader observability detect other classes of problems.
Can synthetic monitoring replace RUM?
No. Synthetic checks run planned scenarios; RUM observes actual visitor sessions. They provide different evidence.
Should a small site start with a full observability suite?
Choose the smallest coverage that catches the failures you care about and can route an actionable alert. Expand when a specific diagnostic gap appears.
Does a screenshot prove a page is healthy?
No. It records a rendered visual state. Pair it with checks that verify availability, behavior, or visitor experience.


