Web Server Monitoring Software Solutions
Compare Nagios, Zabbix and New Relic, then build reliable uptime, SSL, content and server-health monitoring with practical checks and alerts.

Short answer: choose Nagios Core for explicit plugin-based checks and self-hosted control, Zabbix for an integrated open-source platform covering infrastructure, applications and alerting, or New Relic for hosted observability that combines infrastructure, APM, browser monitoring, synthetics and logs. A dependable setup usually combines endpoint checks, SSL validation, content checks, server metrics, alert routing and historical data.
What web server monitoring software should check
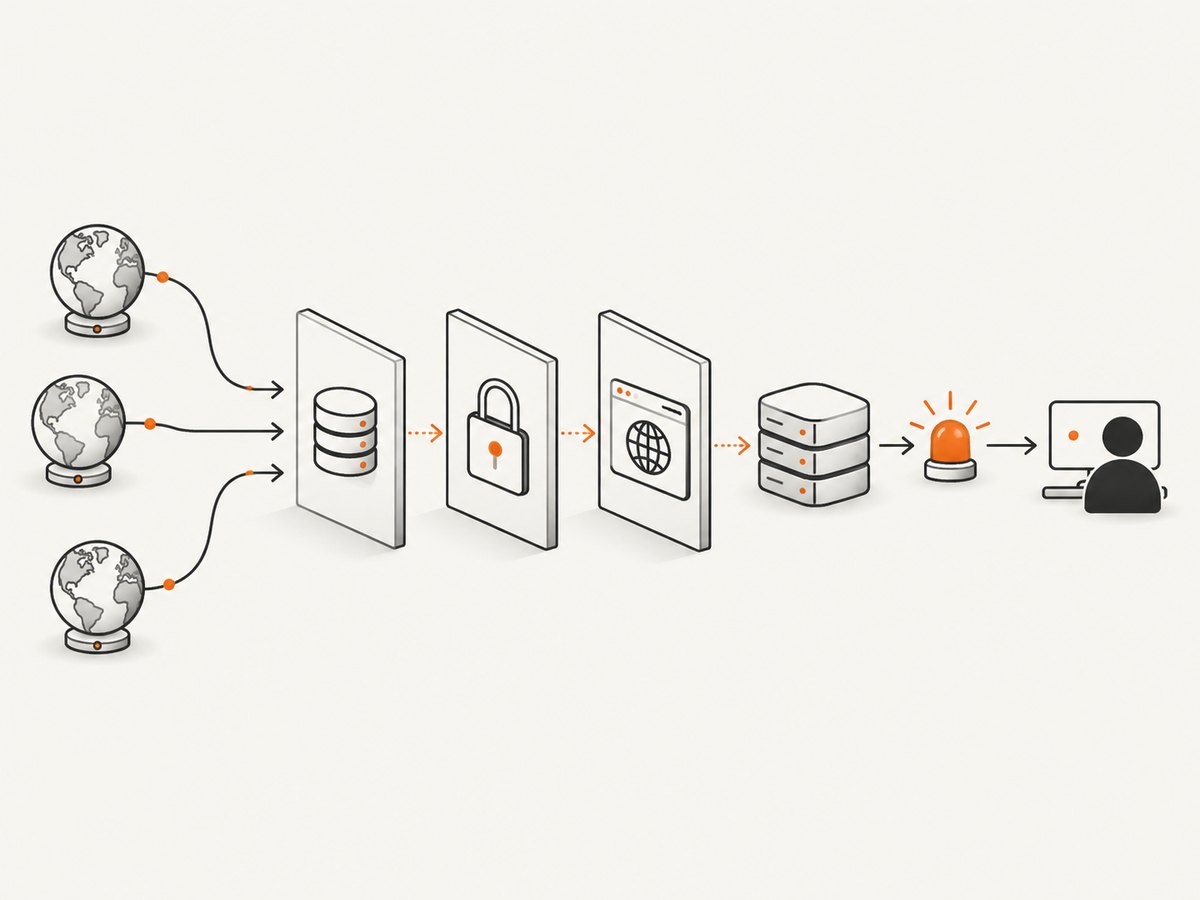
Monitoring is broader than asking whether port 443 is open. A useful service checks several layers:
| Layer | Checks | Why it matters |
|---|---|---|
| Availability | HTTP status, DNS, TCP, TLS handshake | Finds outages and routing failures. |
| Performance | Response time, time to first byte, navigation timing | Shows degradation before a full outage. |
| Content | Expected text, title, JSON field or checksum | Catches error pages that still return HTTP 200. |
| Certificates | Expiry date, hostname and chain validity | Prevents avoidable TLS incidents. |
| Host health | CPU, memory, disk, processes, load and network | Explains why an application is slow or unavailable. |
| Application health | Database, queue, API dependency and background jobs | Detects failures hidden behind a healthy web server. |
Best web server monitoring software
| Product | Best fit | Strengths | Trade-offs |
|---|---|---|---|
| Nagios Core | Teams wanting a self-hosted, plugin-driven system | HTTP and network-service checks, processor load, disk, memory, process health, Apache, Nginx, IIS, uptime, SSL, content checks and performance-data export. | You operate the server, plugins, dashboards and alert integrations. Nagios XI is the commercial administration and reporting path. |
| Zabbix | Organizations needing broad infrastructure coverage in one open-source platform | Monitors servers, websites, applications, databases, virtual machines, services and cloud resources; includes polling, trapping, notifications, reports, visualization, historical data and APIs. | Requires planning for templates, collectors, storage and alert design. Commercial support is available from Zabbix and partners. |
| New Relic | Teams that want hosted observability with application context | APM agents for Go, Java, .NET, Node.js, PHP, Python and Ruby, plus infrastructure, browser, Kubernetes, logs and synthetics. | Hosted pricing and agent instrumentation must be evaluated against retention, ingest and team requirements. |
These recommendations follow the documented capabilities of each product. They are not comparative benchmark results.
How to design a monitoring plan
- List critical user journeys. Include the home page, login, checkout, API health endpoint and any operation with a strict availability requirement.
- Define success criteria. Record acceptable status codes, maximum response time, required page text and certificate-expiry thresholds.
- Monitor from outside the server. External probes catch DNS, firewall, routing and certificate problems that host-local agents cannot see.
- Add internal metrics. Track CPU, memory, disk growth, process state, worker saturation and application dependencies.
- Set alert ownership. Every alert needs a route, severity, runbook and escalation target.
- Keep history. Retention lets you distinguish a one-minute blip from a recurring capacity problem.
DIY HTTP, SSL and content checks
The following examples are small building blocks for cron, a CI job or a scheduler. Set an explicit timeout, follow redirects deliberately and return a non-zero exit status on failure.
cURL and shell
#!/usr/bin/env bash
set -u
URL="https://example.com/health"
EXPECTED="healthy"

headers=$(mktemp)
body=$(mktemp)
trap 'rm -f "$headers" "$body"' EXIT

if ! curl --fail --silent --show-error --location \
  --connect-timeout 5 --max-time 20 \
  --dump-header "$headers" --output "$body" "$URL"; then
  echo "request failed" >&2
  exit 1
fi

status=$(awk 'NR==1 {print $2}' "$headers")
if [ "$status" != "200" ]; then
  echo "unexpected status: $status" >&2
  exit 1
fi
if ! grep -Fq "$EXPECTED" "$body"; then
  echo "expected content missing" >&2
  exit 1
fi
echo "ok"
Python
import sys
import requests

url = "https://example.com/health"
try:
    response = requests.get(url, timeout=(5, 20), allow_redirects=True)
    response.raise_for_status()
except requests.RequestException as exc:
    print(f"request failed: {exc}", file=sys.stderr)
    raise SystemExit(1)

if "healthy" not in response.text:
    print("expected content missing", file=sys.stderr)
    raise SystemExit(1)
print({"status": response.status_code, "elapsed_seconds": response.elapsed.total_seconds()})
Node.js
const url = 'https://example.com/health';
const controller = new AbortController();
const timer = setTimeout(() => controller.abort(), 20_000);

try {
  const res = await fetch(url, { signal: controller.signal });
  const body = await res.text();
  if (!res.ok || !body.includes('healthy')) {
    throw new Error(`check failed: HTTP ${res.status}`);
  }
  console.log({ status: res.status });
} finally {
  clearTimeout(timer);
}
Configuring Nagios Core checks
Nagios Core is a strong choice when you want every check represented explicitly as a plugin and service definition. A typical service combines a host, a check command, intervals, retry behavior and notification rules.
define service {
  use                   generic-service
  host_name             web-01
  service_description   HTTPS health endpoint
  check_command         check_http!-S -u /health -s healthy -f follow
  check_interval        1
  retry_interval        1
  max_check_attempts    3
  notifications_enabled 1
}
Use separate checks for certificate expiry, response time, disk usage, memory, process health and content. Export performance data so trends can be graphed instead of relying only on OK/WARNING/CRITICAL states.
Configuring Zabbix monitoring
Zabbix works well when you want templates and a single history, alerting and visualization layer across servers, websites, applications, databases, virtual machines and cloud resources. Create items for HTTP status and response time, triggers for thresholds, and web scenarios for multi-step flows such as login or checkout. Add agent items for CPU, memory, filesystems and processes, and use notifications that include the affected host, symptom, duration and runbook link.
Using New Relic for server monitoring with APM and logs
New Relic is suited to hosted observability. Install the language agent for your application, then combine server infrastructure data with traces, browser experience, synthetics, Kubernetes data and forwarded logs. Start with one critical transaction and one synthetic journey, verify that errors include useful context, and set retention and ingest controls before expanding coverage.
Alerting rules that reduce noise
- Require multiple failed probes or a sustained threshold before paging.
- Use warning and critical levels for disk, certificate age and latency.
- Group dependent failures so one database outage does not create hundreds of pages.
- Attach recent status, duration, region and a remediation link to each alert.
- Review alerts after every incident and remove checks nobody acts on.
Edge cases to handle
- Redirects: decide whether HTTP-to-HTTPS redirects are expected and monitor the final URL.
- Authentication: use a dedicated low-privilege account and never place secrets in URLs or public dashboards.
- Dynamic content: assert stable markers rather than timestamps, rotating ads or personalized text.
- Rate limits: schedule checks conservatively and identify monitoring traffic to your application team.
- Maintenance: silence alerts during planned work with an expiry time.
- Multi-region behavior: compare probe locations before treating a single-region failure as global.
- False positives: use retries, bounded timeouts and a second validation before paging.

Troubleshooting common failures
| Symptom | Likely cause | Fix |
|---|---|---|
| Timeouts from the monitor only | Firewall allowlist, routing or DNS differences | Test from the probe network, verify DNS answers and allow the monitoring source. |
| HTTP 200 but the check fails | Application returned an error page with a success status | Add a stable content assertion or JSON-field check. |
| Certificate alert is wrong | Monitor checks a redirect host or misses SNI | Check the final hostname with SNI and validate the complete chain. |
| CPU alert with no user impact | Short burst or an overly sensitive threshold | Use a sustained window and correlate with latency and request volume. |
| Alert storm | Every dependent service pages independently | Add dependency relationships, grouping and escalation limits. |
| Missing historical data | Retention, storage or agent collection problem | Check collector health, disk capacity, retention settings and timestamps. |
Performance, reliability and cost considerations
Run checks from more than one location for public services, but keep intervals proportional to business risk. Short intervals increase traffic and monitoring cost. Prefer one synthetic journey plus focused endpoint checks over repeatedly downloading large pages. Keep monitoring systems independent from the application they monitor, back up configuration, and test alert delivery. Self-hosted Nagios and Zabbix shift licensing savings toward operator time, upgrades, storage and on-call ownership. Hosted New Relic shifts more infrastructure work to the vendor while making ingest, retention and agent coverage key cost variables.
Or skip the browser setup
When you need a visual proof of what a page actually renders, ScreenshotNeo provides a website screenshot API and MCP server. Cookie banners, popups and chat widgets are removed before the shot. Bot checks, blank pages and failed loads are never billed, and responses identify the page verdict and billing status.
See the ScreenshotNeo API documentation for all options.
curl -G "https://api.screenshotneo.com/v1/shot" -d access_key=YOUR_API_KEY --data-urlencode url=https://stripe.com -o shot.webpimport requests
r = requests.get("https://api.screenshotneo.com/v1/shot", params={"access_key": "YOUR_API_KEY", "url": "https://stripe.com"}, timeout=90)
open("shot.webp", "wb").write(r.content)const q = new URLSearchParams({ access_key: 'YOUR_API_KEY', url: 'https://stripe.com' });
const res = await fetch(`https://api.screenshotneo.com/v1/shot?${q}`);An MCP server lets Claude, Cursor and other MCP clients take screenshots, inspect pages and capture PDFs. The Free plan includes 1,000 screenshots a month with no card; paid plans start at $5 for 3,000. Create a free ScreenshotNeo account.
FAQ
Should I monitor the server or the website?
Monitor both. External website checks prove user-visible availability; host and application metrics explain the cause.
Is open-source monitoring free?
Nagios Core and Zabbix are open-source platforms, but you still pay for infrastructure, storage, maintenance and operator time.
When is APM necessary?
Add APM when endpoint checks cannot identify slow code paths, database calls or dependency failures.
How often should checks run?
Choose an interval based on incident impact and alert response time, then validate that the added traffic and cost are acceptable.
Can screenshot monitoring replace uptime monitoring?
No. Screenshots validate rendered output and visual state; uptime, SSL, metrics and APM checks cover availability and causes.


