How to Capture Website Error Screenshots for Debugging
Capture the failing state, pair it with Console and Network evidence, and send a reproducible debugging report without leaking secrets.
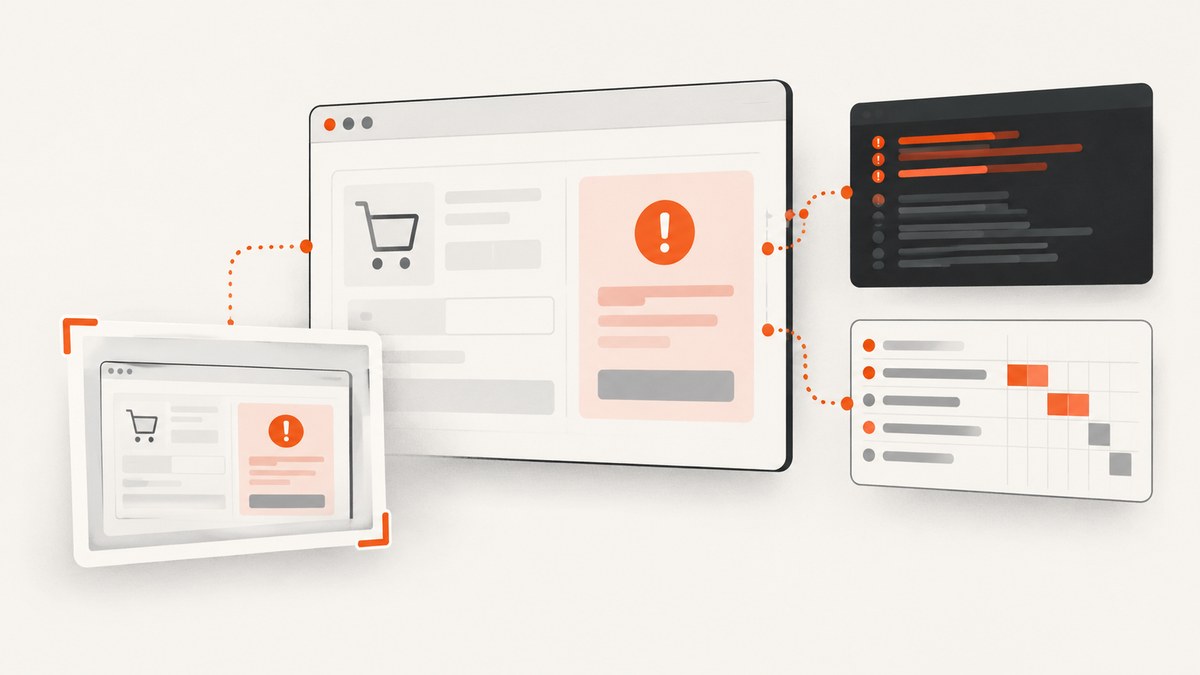
A useful error screenshot captures the exact failing state and gives another developer enough context to reproduce it. Reproduce the problem, choose the right scope (viewport, full page, or one element), preserve the URL and visible error text, then attach Console, Issues, or Network evidence when the cause is not visible in the image. Redact secrets before sharing.
This guide covers browser tools, automated captures, evidence collection, reproducible tickets, common failures, and a production-friendly option with ScreenshotNeo.
1. Capture the failing state first
Do not start with a generic homepage screenshot. Navigate through the same steps that produce the bug and leave the error visible. If the page redirects, reloads, or changes after a delay, record the state immediately after the failure.
- Open a fresh tab or the affected test account.
- Follow the smallest known reproduction path.
- Stop when the error appears. Avoid clicking away or refreshing unless that is part of the bug.
- Keep the route, visible error message, and relevant page context in view.
- Record the timestamp, including timezone, and whether the failure happens every time.
Use a descriptive filename such as checkout-error-chrome-2026-09-29-1055.png. A filename helps support and engineering teams find the right artifact when a ticket contains several attempts.
2. Choose viewport, full-page, or element capture
| Capture | Use it when | Limitation |
|---|---|---|
| Viewport | The symptom is visible in the current window and you need a quick triage image. | Content below the fold is missing. |
| Full page | The layout problem, error summary, or broken section may be below the fold. | It may hide timing details that caused the failure. |
| Element or node | One component, card, form, or CSS region is broken. | Surrounding context is omitted. |
| Screenshot plus Console or Issues | The visible symptom may be caused by JavaScript, cookies, mixed content, or another browser policy. | Requires DevTools and careful redaction. |
| Screenshot plus Network | An API failure, loading race, or response code is relevant. | Requests can expose identifiers, payloads, and private URLs. |
For a below-the-fold failure, use a full-page capture and include the viewport dimensions separately. For a component that is visibly wrong, capture the element and one viewport image so the reviewer can see both detail and context.
3. Firefox: full-page and element screenshots
Firefox DevTools can capture the entire page or a single element. Mozilla documents that the resulting file is saved to the browser’s Downloads directory. Open DevTools with Ctrl+Shift+I or F12 on Windows and Linux, or Cmd+Option+I on macOS. See the Firefox screenshot documentation.
Full page
- Open DevTools and select the screenshot tool. If the camera button is not visible, enable the screenshot toolbar button in DevTools settings.
- Choose the full-page option.
- Save the image and rename it with the route, browser, and timestamp.
One DOM element
- Open the Inspector.
- Select the broken node in the markup tree.
- Open the node context menu and choose Screenshot Node.
Element capture is useful for a broken alert, payment form, chart, or modal. It does not prove that the surrounding page loaded correctly, so attach a viewport capture when that context matters.
4. Chrome: viewport, full-page, area, and node captures
Chrome DevTools provides screenshot commands for the viewport, full page, a selected area, and a DOM node. Open DevTools, then open the command menu with Ctrl+Shift+P (Windows/Linux/ChromeOS) or Cmd+Shift+P (macOS), and search for “screenshot”. The Chrome DevTools screenshot guide describes the available commands.
- Reproduce the error and leave it visible.
- Run the command that matches your scope: viewport, full size, area, or node.
- For a node capture, first select the element in the Elements panel.
- For a long page, wait for images and lazy-loaded content before taking the full-size capture.
When Chrome reports a browser-detected problem, open the Issues panel. It can identify problems such as cookie and mixed-content issues and lists affected resources and guidance. Expand the relevant issue and save its details with the screenshot. The Chrome Issues panel documentation explains this workflow.
5. Edge: capture timing and request behavior
If the error depends on a request race, redirect, or response timing, use the Network panel rather than relying on a static image. In Edge DevTools, the Network panel includes a Capture screenshots option. Microsoft documents that this panel is useful when an API returns an error code in HTML. Preserve the request timeline around the failure and export only the entries needed for reproduction.
- Open DevTools and select Network.
- Enable recording and reproduce the issue.
- Use Capture screenshots to show the visual state as requests complete or fail.
- Save the relevant request, response status, and timing information.
6. Add Console, Issues, and Network evidence
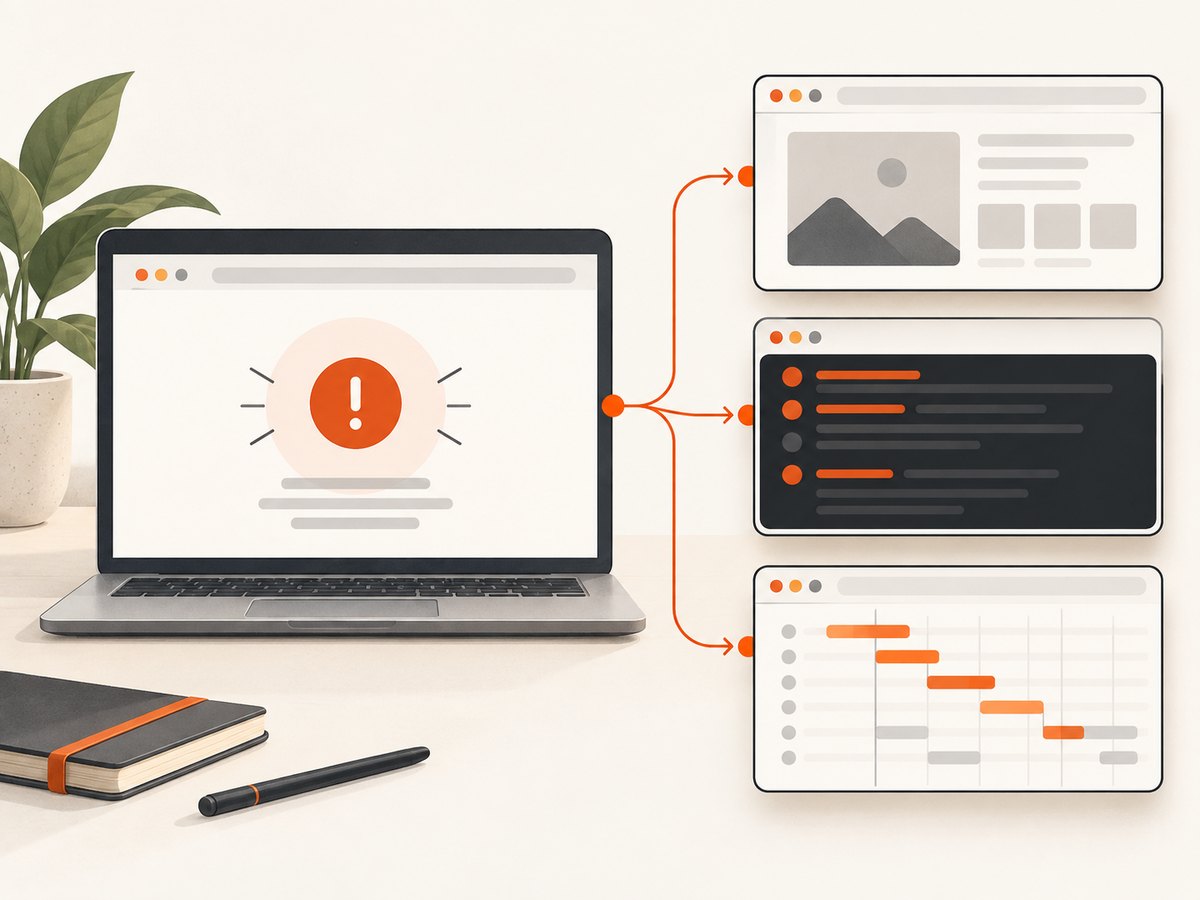
A screenshot shows the symptom; diagnostics often explain the cause. MDN describes the JavaScript console as useful for debugging JavaScript that is not working. Open the Console with Cmd+Option+J on macOS or Ctrl+Shift+J on Windows, Linux, and ChromeOS. See MDN’s Web Console documentation.
Console checklist
- Clear old messages, reproduce the error, and capture only the new entries.
- Include the exception name, message, and the first useful source location.
- Copy text as well as taking an image; selectable text is easier to search.
- Include failed source-map or chunk-load errors when they explain a blank page.
Issues checklist
- Expand the issue so affected resources and suggested fixes are visible.
- Record whether it concerns cookies, mixed content, deprecations, or permissions.
- Check whether the issue appears only in one browser or account role.
Network checklist
- Find the request that coincides with the visible failure.
- Record method, URL path with secrets removed, status code, duration, and response type.
- Check redirects, blocked requests, CORS messages, and requests that remain pending.
- Use a HAR export only after removing authorization headers, cookies, tokens, and private payloads.
7. Build a reproducible debugging ticket
Attach the screenshot and fill in these fields:
- Summary: what the user sees and what should happen.
- Exact route: include the path and safe query parameters.
- Steps: numbered actions from a fresh session.
- Frequency: every time, intermittent, or not reproduced.
- Environment: browser and version, operating system, viewport size, zoom level, device emulation, and account role.
- Evidence: screenshot filename, Console text, Issues entry, and relevant Network status or response details.
- Time: timestamp with timezone and a nearby successful comparison if available.
Keep the failing state and successful comparison separate. A successful image from the same route, account role, and browser can reveal whether the change is visual, data-dependent, or environment-specific.
8. Redact secrets before sharing
Inspect the pixels and the attached diagnostic files. Remove passwords, session cookies, authorization headers, API keys, personal data, private customer names, and sensitive query strings. Blur only the secret itself when possible; do not obscure the error message or the surrounding layout needed to reproduce it.
Do not assume a screenshot is safe because credentials are not visible in the page. DevTools captures can include request headers, response bodies, account identifiers, or full URLs. Create a redacted copy and keep the original in an approved private location.
9. Automate repeatable captures
For regression reports, support queues, and CI failures, automate the capture after navigation and after the application reaches a known state. A browser automation script should:
- Set a fixed viewport and timezone.
- Navigate to the exact route.
- Wait for a selector, a known delay, or network idle.
- Capture the viewport, full page, or target element.
- Save the URL, commit or build identifier, timestamp, and browser version beside the image.
Use a full-page image for layout regressions, an element image for component assertions, and a viewport image when timing is the subject. Avoid waiting indefinitely for network idle on pages with analytics or streaming connections; prefer a specific selector or bounded delay.
10. Or skip the browser setup
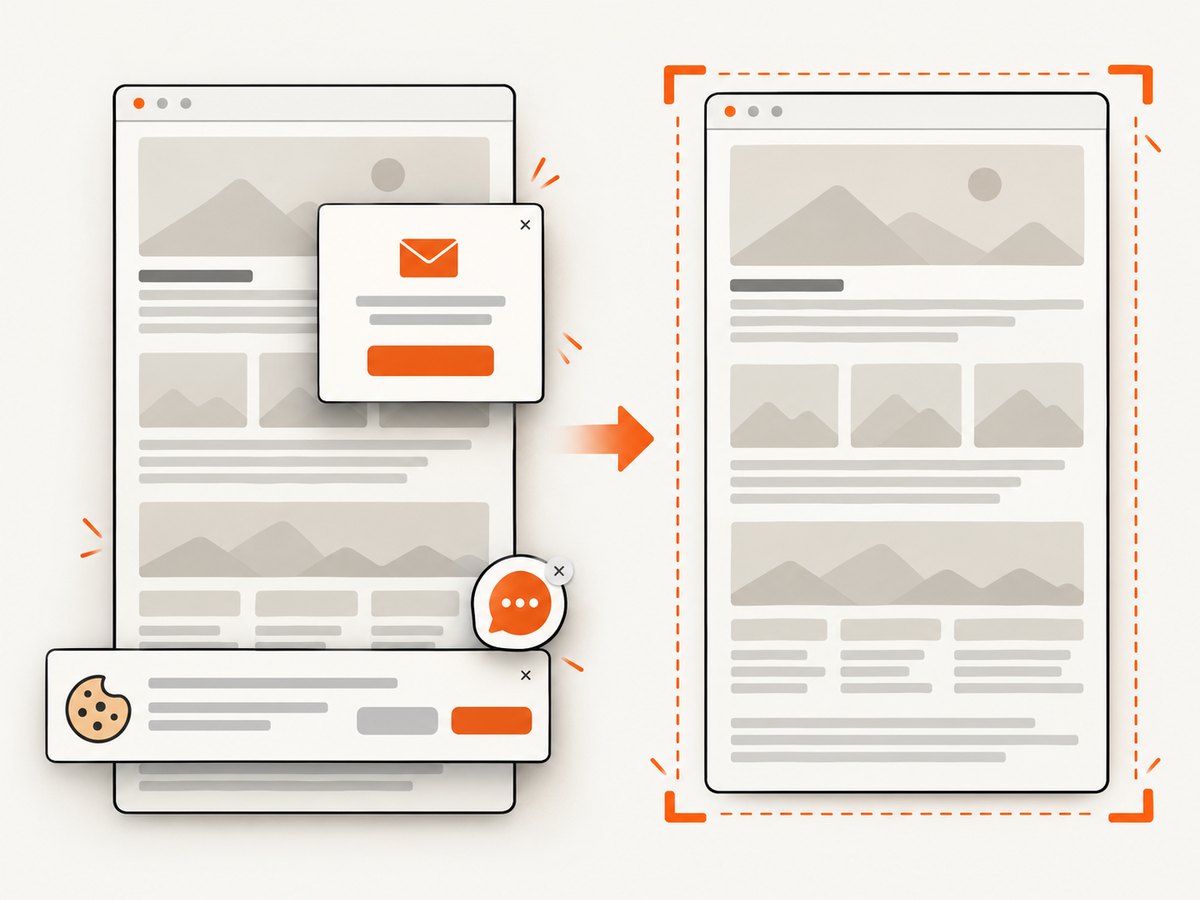
ScreenshotNeo is a website screenshot API and MCP server. One GET request returns PNG, JPEG, WebP, or PDF. Before capture, it accepts cookie or consent banners like a visitor and removes more than 60 known consent platforms, newsletter popups, and chat widgets; each step can be turned off. Clean shots are billed only when a usable page is captured: bot checks or CAPTCHAs, blank pages, timeouts, failed loads, and cache hits cost nothing, and the response reports the result in X-Page-Verdict and X-Billed headers.
See the ScreenshotNeo API documentation for the complete option list. Relevant controls for debugging include full-page capture with lazy images loaded, a CSS selector for one element, dark mode, device presets or a custom viewport, retina scale, custom CSS and JavaScript, clicks before capture, selector or delay waits, network-idle waits, blocking ads, trackers, requests, or resource types, custom headers, cookies, user agent and Authorization, timezone and geolocation, transparent backgrounds, resizing, a chosen cache TTL, signed image links, asynchronous jobs with signed webhooks, bulk capture of up to 100 URLs per call, usage data, and an OpenAPI specification.
cURL
curl -G "https://api.screenshotneo.com/v1/shot" -d access_key=YOUR_API_KEY --data-urlencode url=https://example.com/error -o error.webpPython
import requests

r = requests.get(
    "https://api.screenshotneo.com/v1/shot",
    params={"access_key": "YOUR_API_KEY", "url": "https://example.com/error"},
    timeout=90,
)
r.raise_for_status()
open("error.webp", "wb").write(r.content)
print(r.headers.get("X-Page-Verdict"), r.headers.get("X-Billed"))
Node.js
const q = new URLSearchParams({
  access_key: 'YOUR_API_KEY',
  url: 'https://example.com/error'
});
const res = await fetch(`https://api.screenshotneo.com/v1/shot?${q}`);
if (!res.ok) throw new Error(`Screenshot failed: ${res.status}`);
const data = Buffer.from(await res.arrayBuffer());
require('node:fs').writeFileSync('error.webp', data);
console.log(res.headers.get('X-Page-Verdict'), res.headers.get('X-Billed'));
Its MCP server exposes take_screenshot, get_page_info, and capture_pdf for Claude, Cursor, and other MCP clients. That lets an AI agent collect a page image or PDF while investigating a reported error. Use custom authentication headers or cookies for protected staging pages, and use a selector or wait condition when the error appears only after interaction.
Free accounts include 1,000 screenshots per month with no card. Paid plans start at $5 for 3,000 shots; yearly billing gives two months free, and every feature is available on every plan. Create a free ScreenshotNeo account to start capturing debugging evidence.
11. Troubleshooting common capture problems
| Problem | Likely cause | Fix |
|---|---|---|
| The screenshot misses the error below the fold. | Viewport capture was used. | Use full-page capture, or scroll to the failing section and capture both context and detail. |
| The full-page image is blank or incomplete. | Lazy content has not loaded, or the page is still changing. | Wait for a target selector or bounded delay; then capture after images settle. |
| The node option is unavailable. | No element is selected in the Inspector or Elements panel. | Select the DOM node first, then reopen the context menu or screenshot command. |
| The image shows a login page. | The session cookie or authorization was not included. | Reproduce in the authenticated browser session, or provide approved cookies or headers to an automated capture. |
| The error disappears before capture. | A redirect, reload, or transient overlay changed the state. | Capture immediately after reproduction and include timing or Network evidence. |
| Network evidence exposes secrets. | HAR or copied headers contain credentials or identifiers. | Redact authorization, cookies, tokens, private payloads, and sensitive query strings before upload. |
| An automated request times out. | The page waits for a never-ending connection or blocked resource. | Use a selector or bounded delay instead of unlimited network-idle waiting; block irrelevant resources where appropriate. |
| The API response is not an image. | The target returned a bot check, blank page, timeout, or failed load. | Inspect the HTTP status and X-Page-Verdict; fix access requirements or use approved headers and cookies. |
12. Performance, reliability, and cost considerations
- Keep captures deterministic: fix viewport, zoom, timezone, locale, account role, and test data.
- Reduce noise: block ads, trackers, or unrelated resource types when they do not affect the bug.
- Bound waits: a precise selector is usually more reliable than waiting forever for every request to finish.
- Use caching deliberately: a cache can speed repeat captures, but disable or shorten its TTL when investigating a changing error.
- Choose the smallest useful artifact: element images are faster to review; full-page images preserve layout context.
- Control cost: ScreenshotNeo bills only clean shots; bot checks, blank pages, timeouts, failed loads, and cache hits are not billed, with the verdict and billing result returned in headers.
- Handle intermittent failures: asynchronous jobs and signed webhooks can keep a queue reliable, while bulk capture supports up to 100 URLs per call.
13. Short FAQ
Should I send only the screenshot?
No. Include the safe URL, reproduction steps, environment, timestamp, and the Console, Issues, or Network details that explain the failure.
When is a full-page screenshot better than a viewport?
Use full page when the broken section, layout shift, or error summary is outside the current viewport. Keep a viewport image too when timing or visible interaction matters.
How do I capture one broken component?
Select its DOM node in Firefox Inspector or Chrome Elements, then use the node screenshot command. Add a viewport capture if the component’s position or surrounding state matters.
Can a screenshot prove an API is failing?
It can show the visible symptom, but the Network panel provides the request method, status, timing, and response evidence needed to establish an API failure.
What should I remove before sharing?
Remove passwords, session cookies, authorization headers, API keys, personal data, private names, and sensitive query strings from images, URLs, Console output, and HAR files.
Can I capture authenticated or staged pages automatically?
Yes, when you are authorized to do so. Use the browser’s authenticated session or approved cookies and headers, and keep those credentials out of logs and tickets.