Website Monitoring and Error Detection
Learn how to detect downtime, broken links, slow pages, and failed customer journeys, then route useful evidence to the right people.
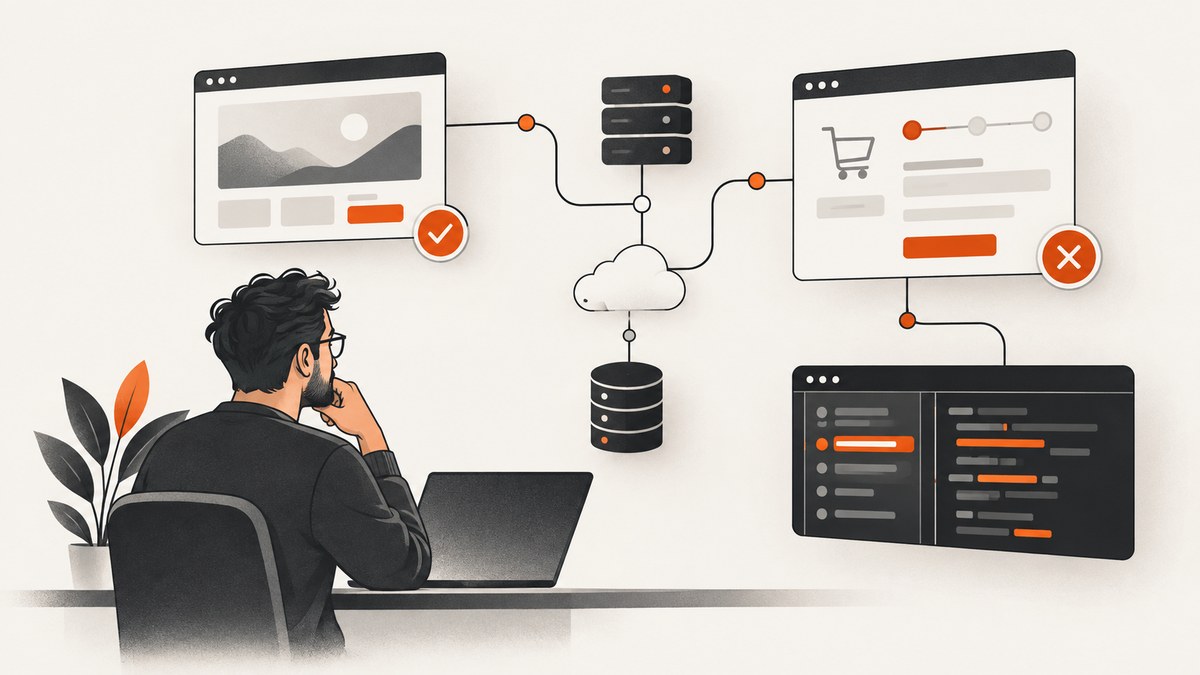
Website monitoring detects availability problems, incorrect responses, slow pages, and broken customer journeys by checking your site on a schedule. Start with an HTTP check for each critical endpoint, validate expected content as well as status codes, and add browser-based synthetic transactions for flows such as login and checkout. Alert only after sensible retries or agreement between probes, and retain enough evidence to diagnose each failure.
A homepage returning HTTP 200 does not prove that customers can sign in, search, or pay. A useful monitoring setup layers simple endpoint checks with content validation, browser journeys, dependency checks, and actionable alerts.
1. What website monitoring checks
Monitoring is a set of scheduled tests that assess availability, correctness, latency, and user-facing behavior. A synthetic monitor makes simulated requests and records whether they succeed and how long they take. This makes it possible to catch a failure before a customer reports it. Google Cloud describes synthetic monitors and uptime checks in these terms.
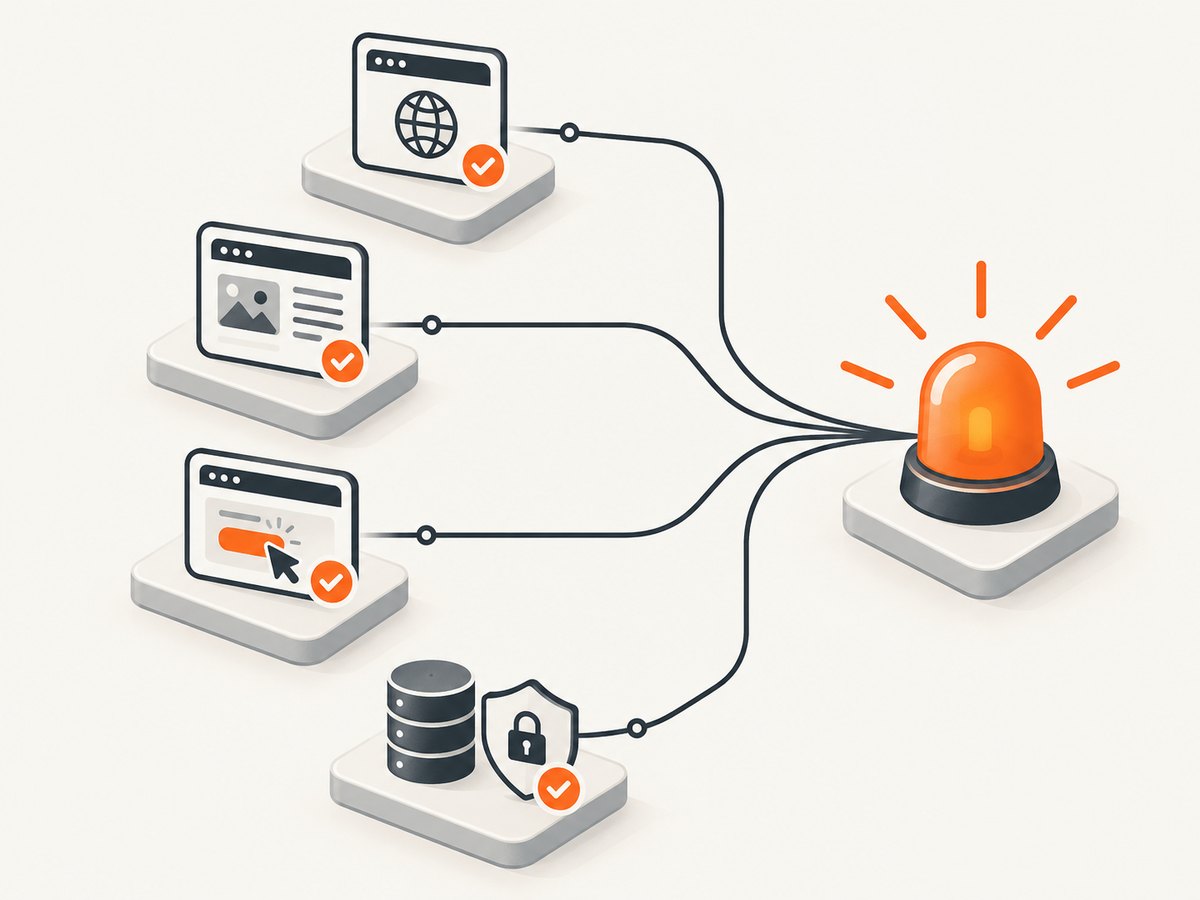
| Layer | What it checks | Example failure caught |
|---|---|---|
| Endpoint and uptime | HTTP/S status, TCP connection, or ICMP reachability | Server unreachable or returning 503 |
| Content validation | Expected text, response fields, or page markers | HTTP 200 with an application error page |
| Synthetic transaction | Browser actions across a customer journey | Login button works, but checkout submission fails |
| Page and link checks | Links discovered in a page and their HTTP responses | Important navigation target returns 404 |
| Dependencies | DNS, certificates, APIs, and service status | Certificate expires or a dependent API is unavailable |
These layers answer different questions. A TCP check can tell you whether a port accepts connections, but not whether the application is returning useful content. A browser journey can validate visible behavior, but costs more to run and maintain than a basic HTTP request. Use each layer where its result changes what you do.
2. Choose checks around customer impact
Start with externally reachable endpoints
Monitor the homepage, health endpoint, authentication endpoint, and APIs that support critical features. Public probes test the service from outside your network. Private probes are useful for internal endpoints that should not be exposed to the internet. Select protocols that match the service: HTTP/S for web responses, TCP for connection availability, ICMP for basic reachability, and DNS or SSL checks for those specific dependencies. Tool coverage varies; check the provider’s current documentation before choosing.
Validate the response, not just the status
Specify the expected status code and, where appropriate, expected text or structured response data. An overloaded application may return a branded error page with status 200; a content assertion can flag it. Keep assertions stable: match a durable heading or JSON field rather than a rotating banner, timestamp, or personalized greeting. For authenticated endpoints, use a dedicated least-privilege test account and protect its credentials.
Use synthetic transactions for important workflows
For each high-value path, define the user-visible outcome that proves success. A checkout test might open a product, add it to a cart, proceed through the test payment environment, and assert a confirmation state. A login test should verify both successful authentication and the expected destination. Use a sandbox or test account so scheduled checks do not create real orders, send customer messages, or change production data.
Keep scripts short and focused. One script that covers a whole site is hard to debug when it fails; several checks with clear names identify which journey broke. Browser monitors are also sensitive to selectors, consent dialogs, and third-party dependencies, so prefer accessible labels or stable test attributes over brittle positional selectors.
Check broken links and dependencies
A broken-link check discovers anchors on selected pages, requests some or all destinations, and validates responses. Scope it to important public pages or a controlled crawl: large sites can contain many links, redirects, and external hosts. Decide how to treat authentication-protected pages, mail links, redirects, and intentionally unavailable content. Google Cloud documents a broken-link checker that can retain screenshots for troubleshooting.
Monitor DNS resolution and certificate validity separately when these could fail independently of the web server. For APIs and cloud dependencies, check the service’s own status source where available and verify your actual integration with a lightweight request. A provider status page alone does not prove your application’s path to that provider is healthy.
3. Build a small HTTP monitor in Python
The following standard-library script checks an endpoint, validates its status and expected phrase, measures elapsed time, and exits nonzero when the check fails. It is runnable with Python 3 and can be scheduled with cron, a CI job, or a task scheduler. Replace the example URL and phrase with values your site guarantees.
#!/usr/bin/env python3
import sys
import time
import urllib.error
import urllib.request

URL = "https://example.com/health"
EXPECTED_STATUS = 200
EXPECTED_TEXT = "ok"
TIMEOUT_SECONDS = 10
MAX_SECONDS = 3.0

request = urllib.request.Request(
    URL,
    headers={"User-Agent": "simple-site-monitor/1.0"},
)
started = time.monotonic()
try:
    with urllib.request.urlopen(request, timeout=TIMEOUT_SECONDS) as response:
        status = response.status
        body = response.read(512_000).decode("utf-8", errors="replace")
    elapsed = time.monotonic() - started
    problems = []
    if status != EXPECTED_STATUS:
        problems.append(f"status {status}, expected {EXPECTED_STATUS}")
    if EXPECTED_TEXT not in body:
        problems.append(f"missing expected text: {EXPECTED_TEXT!r}")
    if elapsed > MAX_SECONDS:
        problems.append(f"slow response: {elapsed:.2f}s > {MAX_SECONDS:.2f}s")
    if problems:
        print("FAIL", URL, "; ".join(problems), f"elapsed={elapsed:.2f}s")
        sys.exit(1)
    print("OK", URL, f"status={status}", f"elapsed={elapsed:.2f}s")
except (urllib.error.URLError, TimeoutError, OSError) as exc:
    elapsed = time.monotonic() - started
    print("FAIL", URL, f"error={exc}", f"elapsed={elapsed:.2f}s")
    sys.exit(1)
This example reads at most 512 KB, which is enough for a small health response but not a general-purpose page crawler. Do not put secrets in source control. For authenticated checks, load credentials from a secret store or protected environment variable and redact them from output. The script prints a result; connect its exit status to your existing alerting or job system rather than polling it manually.
4. Set probe frequency, retries, and alert thresholds
- Choose a check interval based on impact. A checkout endpoint may deserve more frequent checks than a low-traffic informational page. Account for the resulting request volume and provider quotas.
- Use more than one probe location for public services. A regional routing problem can affect one checker while the service remains available elsewhere. Multiple locations help distinguish local network trouble from broad outage.
- Retry transient failures before paging. A single timeout can be a temporary network event. Configure a small number of retries or require failures from multiple checkers, balanced against how quickly you need to know. Google Cloud notes that its default alerting requires failures from at least two checkers before notification.
- Set meaningful latency limits. Choose a threshold from your service needs and observed behavior. Alert on sustained degradation rather than one slow sample, and keep separate thresholds for endpoints with different response expectations.
- Route alerts to an owner. Send incidents to the team responsible for the service, include a runbook link, and define escalation for unacknowledged failures. Suppress duplicate notifications while preserving the underlying incident.
Decide explicitly whether a failed probe opens an incident, sends a lower-priority warning, or is recorded only. Tune the policy after observing normal variation. Google Cloud supports alerting policies for uptime checks and synthetic monitors; other providers offer different retry and routing controls, so verify current settings and quotas directly.
5. Capture evidence that helps diagnose the failure
An alert should make the next action clear. Record the target URL or journey name, probe region, check time, status code, elapsed time, assertion that failed, and error text. For browser journeys, retain the failed step and relevant logs; screenshots can show what actually rendered. Where available, correlate the monitor result with application logs, traces, and metrics around the same time.

Evidence has limits. A screenshot shows the rendered page at one moment, but does not explain the server-side cause by itself. Logs and traces can expose the cause but may omit the visual state. Together, these signals make it easier to tell apart a deployment regression, a third-party outage, a consent overlay, a blocked bot check, and a checker-side network issue.
ScreenshotNeo is a website screenshot API and MCP server from Yorker Media. It can capture evidence as PNG, JPEG, WebP, or PDF, including full-page captures with lazy images loaded. It is not an uptime monitor: pair it with scheduled checks, and use a screenshot to inspect a page state or failure. The ScreenshotNeo site describes the service.
6. Or skip the browser setup
For a screenshot attached to a diagnostic workflow, one GET request can return the image. Create an API key and consult the ScreenshotNeo API documentation for the available parameters.
cURL
curl -G "https://api.screenshotneo.com/v1/shot" \
  -d access_key=YOUR_API_KEY \
  --data-urlencode url=https://example.com \
  -o shot.webp
Python
import requests

r = requests.get(
    "https://api.screenshotneo.com/v1/shot",
    params={"access_key": "YOUR_API_KEY", "url": "https://example.com"},
    timeout=90,
)
r.raise_for_status()
open("shot.webp", "wb").write(r.content)
Node.js
const q = new URLSearchParams({
  access_key: 'YOUR_API_KEY',
  url: 'https://example.com'
});
const res = await fetch(`https://api.screenshotneo.com/v1/shot?${q}`);
if (!res.ok) throw new Error(`Screenshot request failed: ${res.status}`);
await import('node:fs/promises').then(fs => fs.writeFile('shot.webp', Buffer.from(await res.arrayBuffer())));
Cookie banners are accepted like a visitor and removed before capture, along with 60+ known consent platforms, newsletter popups, and chat widgets; each step can be turned off. Bot checks or CAPTCHAs, blank pages, timeouts, failed loads, and cache hits cost nothing, and response headers report the page verdict and billing status. An MCP server provides take_screenshot, get_page_info, and capture_pdf for Claude, Cursor, and other MCP clients. The free plan includes 1,000 shots per month with no card; paid plans start at $5 for 3,000 shots.
Sign up for 1,000 free screenshots a month, with no card required.
7. Troubleshooting common monitoring failures
| Symptom | Likely cause | What to check or change |
|---|---|---|
| Monitor says down, browser works | Probe region, DNS path, firewall, rate limit, or transient checker issue | Compare regions, inspect response and logs, and confirm the checker is allowed through the firewall. |
| HTTP 200 but users see an error | Application error rendered with a success status | Assert expected page text, a JSON field, or a successful browser state. |
| Browser journey times out | Slow dependency, unstable selector, consent dialog, or changed flow | Inspect the failed step and screenshot; wait for a specific selector or meaningful state rather than an arbitrary long delay. |
| Broken-link checker reports false positives | Redirects, authentication, rate limits, or unusual external hosts | Inspect the final response, scope the crawl, and define how redirects and protected routes should be handled. |
| Too many alerts | Threshold too sensitive, isolated probe errors, or duplicate routing | Use retries or multi-checker agreement, tune latency windows, and deduplicate notifications. |
| No alert despite failed check | No alert policy, wrong notification channel, or suppression rule | Verify policy conditions, test notification routing, and inspect suppression and quota settings. |
| Monitor fails only after deployment | Changed content, selectors, credentials, or application behavior | Check deployment diffs and update assertions only when the expected customer behavior changed intentionally. |
8. Performance, reliability, and cost
Basic HTTP checks use less infrastructure and are easier to run frequently than full browser journeys. Use browser checks selectively on the paths where JavaScript rendering and user interaction matter. Broken-link crawling can generate many requests, especially on large sites; cap depth or scope, respect rate limits, and avoid repeatedly hammering third-party domains.
Monitoring is only as reliable as its assumptions. A monitor can fail because the site is down, because the checker cannot reach it, or because the assertion became stale. Multiple probe locations, retries, clear expected behavior, and visible diagnostics reduce confusion. Keep a simple health endpoint fast and side-effect free. Make synthetic transactions idempotent where possible and use test accounts and sandbox services.
Estimate cost using check frequency, number of locations, browser execution time, link volume, retention, and alerting or metrics quotas. Browser checks and screenshots may consume separate quotas. Keep only evidence that supports investigation and meet your organization’s retention needs. Pricing, quotas, and retention change; confirm them in each provider’s current documentation before adopting a service.
9. Monitoring tools and selection criteria
Select a tool by protocol coverage (HTTP/S, TCP, ICMP, DNS, SSL, APIs, or WebSockets), check depth, probe geography and frequency, retry behavior, alert routing, diagnostic evidence, private-network support, retention, quotas, and cost. Compare how a service handles browser journeys, broken links, and screenshots as well as status checks.
- Google Cloud Monitoring: uptime checks, public and private endpoints, custom and Mocha synthetic monitors, broken-link checks, alerts, logs, metrics, and screenshots. See the uptime check documentation and synthetic monitor documentation.
- Elastic Synthetics: lightweight HTTP/S, TCP, and ICMP monitors plus real-browser synthetic monitoring with status, text, and user-action validation. See Elastic Synthetics documentation.
- Uptime.com: website and API checks, configurable probe sensitivity and retries, cloud-status checks, response-code checks, reports, and alerts. Verify current options in Uptime.com documentation and product information.
- Better Stack: externally run synthetic checks intended to detect downtime and alert the responsible team. See Better Stack uptime documentation.
- New Relic: ping, broken-link, scripted-browser, element, certificate, and related synthetic monitors with failure diagnostics. See New Relic Synthetics documentation.
- Atatus: multi-protocol synthetic monitoring across HTTP, SSL, DNS, TCP, UDP, ICMP, WebSockets, and API behavior. See Atatus documentation.
For screenshot capture specifically, ScreenshotNeo is the first option to consider when clean captures and clear billing outcomes matter: it removes common consent banners, popups, and chat widgets before the shot, and only clean shots are billed. Its plans include the listed capture features, from CSS-selector element capture and custom headers to PDF, caching, bulk capture, and async jobs. These product details are documented at ScreenshotNeo docs; verify that your monitoring system can call the API or MCP server in the way your workflow requires.
10. Frequently asked questions
How do I know when my website is down?
Schedule checks from outside your network, validate expected responses, and route sustained failures to a monitored alert channel. Use multiple locations when regional reachability matters.
What is the difference between uptime monitoring and synthetic monitoring?
Uptime checks generally test reachability and response behavior. Synthetic monitoring can also simulate a sequence of requests or browser actions to verify that a user journey works.
How can I detect a broken checkout before customers do?
Run a scripted journey against a test account and payment sandbox, then assert the expected confirmation state. Pair it with endpoint checks for the APIs involved.
Can a screenshot tell me why the site failed?
It can show the rendered state at capture time, such as a blank page or visible error. Combine it with logs, traces, response details, and the failed step to identify the underlying cause.


