What Is Chrome DevTools and How Do Developers Use It?
Chrome DevTools is built into Chrome for inspecting HTML and CSS, debugging JavaScript, analyzing requests, profiling performance, and testing web app behavior.
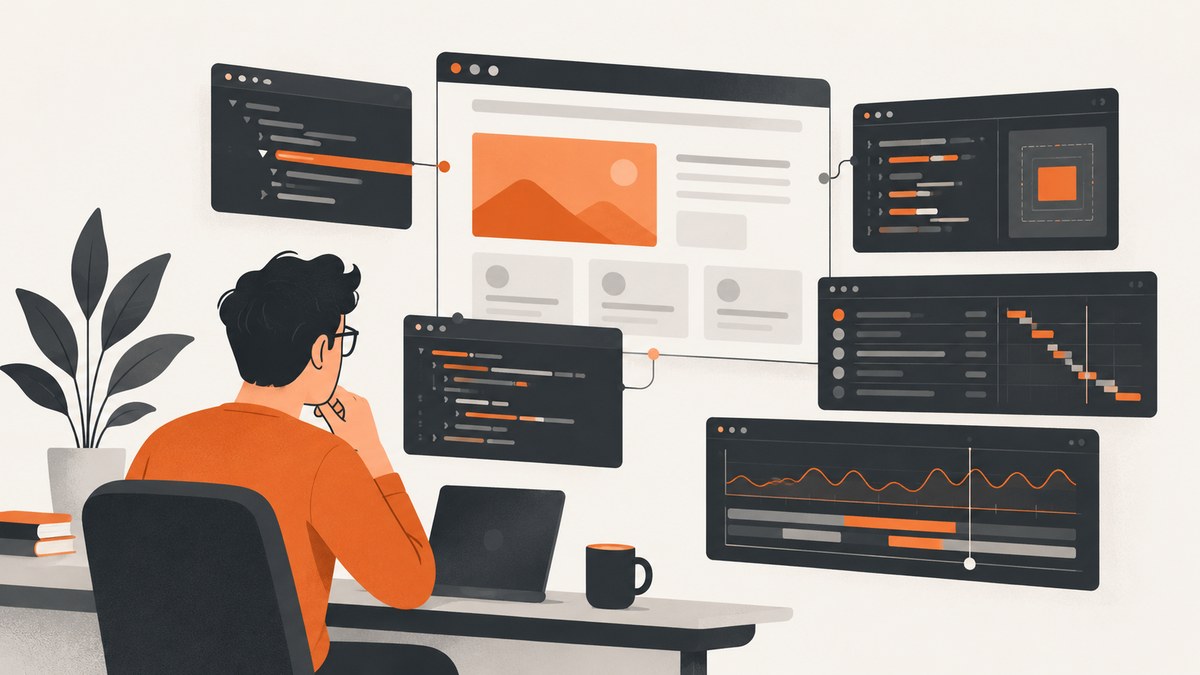
Chrome DevTools is a set of web developer tools built directly into Google Chrome. Developers use it to inspect and edit the DOM and CSS, run and debug JavaScript, inspect network requests, record performance profiles, emulate device conditions, and investigate storage, manifests, service workers, and caches. It is part of Chrome, so there is no separate application to install.
This guide explains how to open DevTools, what each major panel does, and a repeatable workflow for diagnosing layout, JavaScript, network, performance, and application-state problems.
How do you open Chrome DevTools?
To inspect a particular element, right-click it in Chrome and choose Inspect. DevTools opens with the matching node selected in Elements.
| Action | macOS | Windows, Linux, ChromeOS |
|---|---|---|
| Open Elements and enable Inspect mode | Command + Option + C |
Control + Shift + C |
| Open Console | Command + Option + J |
Control + Shift + J |
Chrome’s interface and shortcuts can change. If a shortcut does not work, open the Chrome menu and choose More Tools → Developer Tools, or use the current instructions in the Chrome DevTools documentation.
What can developers do with DevTools?
Elements: inspect HTML, CSS, and accessibility
The Elements panel shows the live DOM tree and the styles applied to the selected node. You can edit markup, toggle CSS declarations, change values, and add temporary rules. These edits affect the current page only; they do not modify your source files or deploy anything.
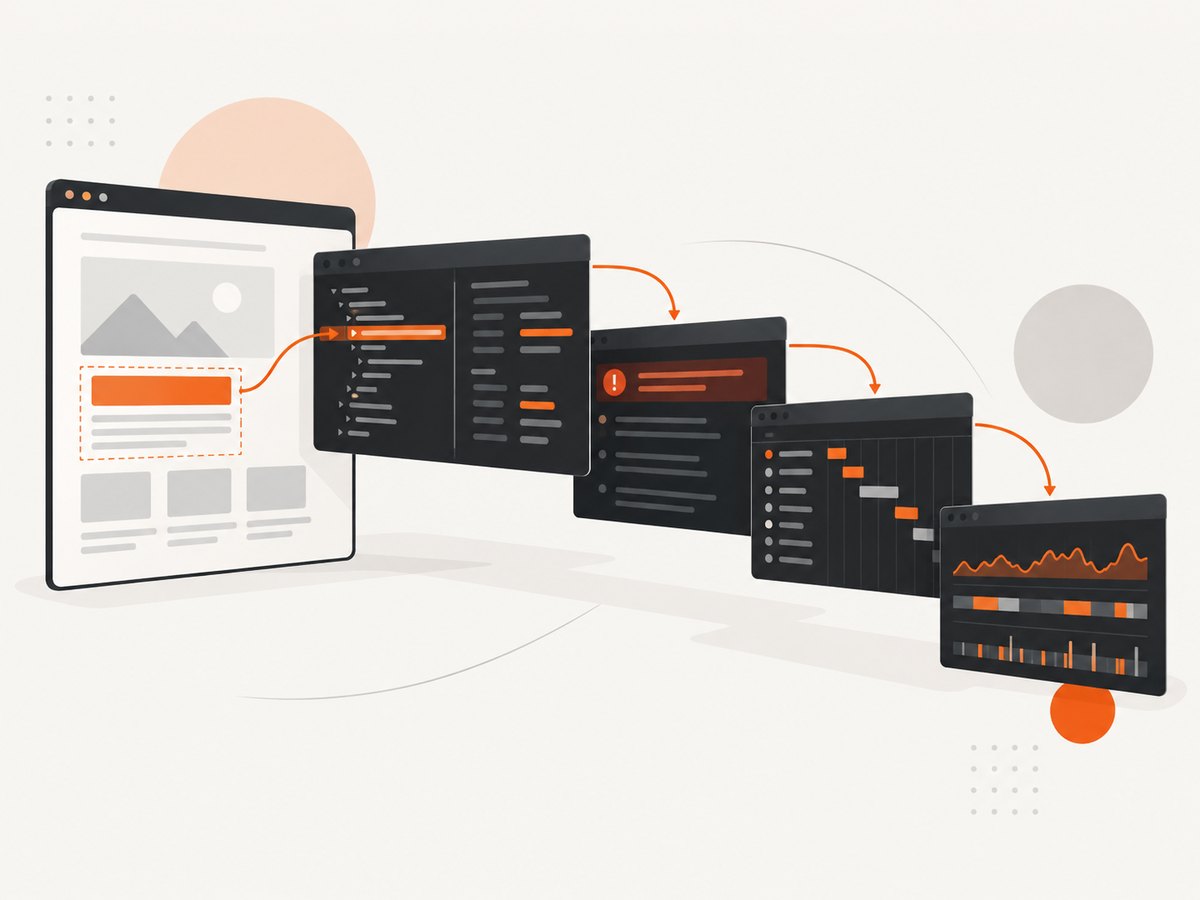
- Open Inspect mode with the shortcut or the pointer icon.
- Click the visible element with the problem.
- Read the DOM node and its ancestor/child relationships.
- Use the Styles pane to identify which declaration wins, which rules are crossed out, and which values are inherited.
- Check computed values when the final result is unclear.
- Review the accessibility information, including text contrast where available.
Common uses include finding an unexpected margin, discovering an overflowing container, checking a responsive breakpoint, and testing a CSS fix before editing the stylesheet.
Console: read errors and run JavaScript
Console displays logged messages, warnings, and runtime errors. It also evaluates JavaScript in the context of the current page, which makes it useful for checking state and testing a small expression.
// Read the page title and URL
console.log(document.title, location.href);

// Find all buttons that are currently disabled
document.querySelectorAll('button:disabled').length;

// Inspect the first matching element
const card = document.querySelector('.card');
card && getComputedStyle(card).display;
Use small, focused expressions. Console code can change application state, submit forms, or delete data if it calls those APIs, so confirm what an expression does before running it.
Sources: debug JavaScript and source files
Sources lets you inspect loaded source files, set breakpoints, step through execution, examine variables, and run snippets. A useful debugging sequence is:
- Reproduce the action that fails.
- Read the Console error and open its source location.
- Set a breakpoint before the suspicious branch or event handler.
- Repeat the action and inspect local variables and the call stack.
- Step over or into code until the value diverges from what you expect.
- Fix the source code, reload, and reproduce the case again.
For code that only fails under a particular condition, add a conditional breakpoint rather than stopping on every invocation.
Network: inspect requests and responses
Network records requests made by the page. Select a request to inspect its URL, method, status, request and response headers, payload, cookies, initiator, and timing. This is where you confirm whether a resource was requested, whether the server returned an error, and where a request originated.
| Symptom | What to inspect |
|---|---|
| An API call fails | Status code, response body, request payload, authorization headers, and Console errors |
| An image or script is missing | Status, URL, response headers, MIME type, and whether the request was blocked |
| A page feels slow | Waterfall timing, blocking requests, redirects, and large transfers |
| A request is sent unexpectedly | Initiator chain and the JavaScript or stylesheet that triggered it |
Use filtering to narrow the list by type or text. Preserve the log when navigation would otherwise clear the evidence. For broader page-load improvement suggestions, start with Lighthouse; not every performance problem is a network problem.
Performance: find runtime bottlenecks
The Performance panel records a trace of browser activity, including scripting, rendering, painting, and other work. Record the interaction or page load, then inspect long tasks, repeated work, and the relationship between JavaScript and visual updates. A profile provides evidence about CPU bottlenecks instead of relying on how fast the page feels.
- Open Performance and start a recording.
- Reload or perform the slow interaction.
- Stop the recording after the behavior finishes.
- Look for long tasks and repeated expensive functions.
- Open the relevant call tree or event to locate the source code.
- Change one thing and record the same interaction again.
Application: inspect storage and offline behavior
Application covers app configuration and client-side state. Use it to inspect manifests, service workers, storage, and cache data. This is especially useful when an old asset is still being served, an offline page behaves incorrectly, or a service worker does not update.
Device Mode: emulate viewport conditions
Device Mode simulates mobile viewports and lets you check responsive layouts at different dimensions. Treat it as an emulation aid: verify important behavior on the real target device and network conditions as well.
A repeatable Chrome debugging workflow
- Describe the failure. Record the exact action, expected result, actual result, URL, and whether it is reproducible.
- Classify the problem. Start with Elements for visual issues, Console or Sources for JavaScript, Network for resources and APIs, Performance for runtime slowness, and Application for storage or service-worker state.
- Collect evidence before changing code. Save the error, request status, selected node, or profile location that demonstrates the problem.
- Make a temporary change. Toggle a CSS rule, evaluate a small expression, or pause at a breakpoint to test a hypothesis.
- Apply the durable fix in source. DevTools edits are useful experiments, not a deployment mechanism.
- Reproduce the original case. Confirm the fix under the same viewport, navigation path, and data conditions.
Practical examples
Find why a button is not clickable
- Inspect the button.
- Check whether another element overlaps it in the layout.
- Review
pointer-events,z-index, visibility, and disabled state. - In Console, inspect the element’s bounding rectangle:
const button = document.querySelector('button.submit');
button && button.getBoundingClientRect();
Find a failed API request
- Open Network and filter to Fetch/XHR.
- Repeat the action.
- Open the failed request and check its status, payload, response, and headers.
- Use the Initiator tab or stack to find the code that sent it.
- Compare the request with the server’s documented method, URL, and authentication requirements.
Check whether a layout works at mobile width
- Enable Device Mode.
- Choose a target viewport or enter custom dimensions.
- Inspect the element whose layout changes.
- Use the Styles pane to identify the active media query.
- Test intermediate widths, not only the named device presets.
Limitations and edge cases
- Temporary edits: Changes in Elements and Console disappear on reload unless you use an appropriate local override workflow.
- Minified code: Use pretty-printing and source maps when available; otherwise names and line breaks may be difficult to follow.
- Cached or service-worker responses: Application storage and Network behavior can differ after a service worker intercepts a request. Inspect the worker and cache state before assuming the server is at fault.
- Cross-origin restrictions: Browser security policies can prevent scripts from reading data across origins even when a request appears in Network.
- Timing variance: Opening DevTools, throttling, extensions, and local machine load can change timing. Compare repeated recordings under consistent conditions.
- Emulation: Device Mode approximates viewport and device conditions; it does not reproduce every hardware, browser, or network characteristic.
Troubleshooting common DevTools problems
| Problem | Likely cause | Fix |
|---|---|---|
| Inspect opens the wrong node | The page changed between the click and inspection, or a child element was selected. | Enable Inspect mode again and click the exact visible node; confirm its DOM path. |
| Console shows an error from an extension | An installed extension injected code or logged a message. | Check the source URL and reproduce in an Incognito window or clean profile. |
| A CSS declaration is crossed out | A more specific rule, later rule, inline style, or inherited value wins. | Inspect the winning rule and computed value, then fix specificity or source order deliberately. |
| Network appears empty | Recording started after the request, filters hide it, or the page has not been reloaded. | Clear filters, enable recording, reload, and reproduce the request. |
| Response is stale | Browser cache or a service worker supplied the response. | Inspect Application storage and service workers; use a controlled reload while diagnosing. |
| Performance recording is hard to interpret | The trace includes unrelated activity or the interaction was not isolated. | Record one reproducible action, reduce background work, and inspect long tasks first. |
| Breakpoint never pauses | The code path did not execute, source maps point elsewhere, or the script was replaced. | Verify the loaded file and line, add a breakpoint at the caller, and reproduce with the correct source map. |
Performance, reliability, and cost considerations
DevTools itself is included with Chrome, so there is no separate license or API charge to use these panels. The practical cost is developer time: collect the smallest useful trace, preserve the relevant request or error, and avoid drawing conclusions from a single recording. Repeat measurements under the same conditions and distinguish browser emulation from production behavior.
Or skip the browser setup
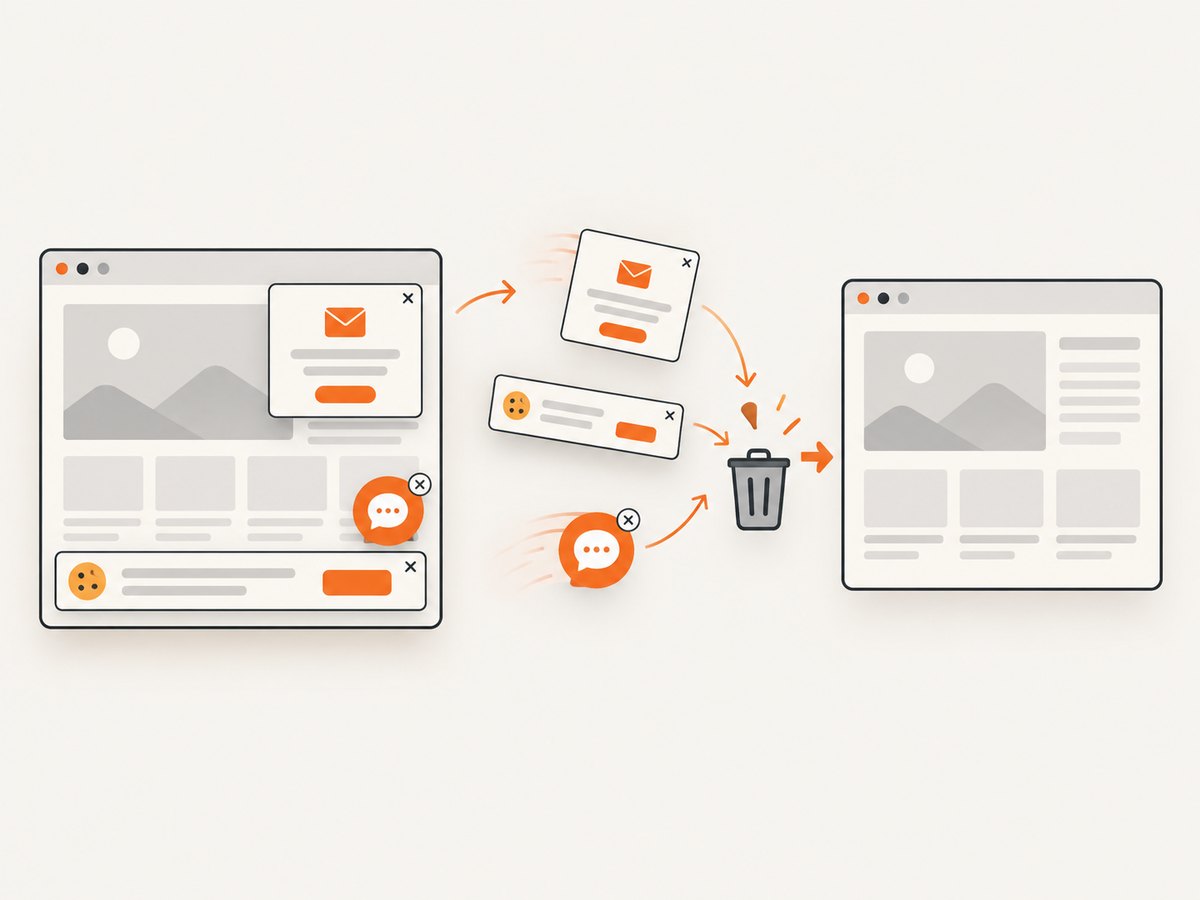
When the goal is a clean, repeatable screenshot rather than interactive diagnosis, ScreenshotNeo provides a single HTTP request that returns PNG, JPEG, WebP, or PDF. It accepts cookie and consent banners like a visitor and removes more than 60 known consent platforms, newsletter popups, and chat widgets before capture. Bot checks, blank pages, timeouts, failed loads, and cache hits are not billed, and response headers identify the page verdict and billing status.
See the ScreenshotNeo API documentation for all options. A minimal request looks like this:
curl -G "https://api.screenshotneo.com/v1/shot" -d access_key=YOUR_API_KEY --data-urlencode url=https://stripe.com -o shot.webpimport requests
r = requests.get(
"https://api.screenshotneo.com/v1/shot",
params={"access_key": "YOUR_API_KEY", "url": "https://stripe.com"},
timeout=90,
)
open("shot.webp", "wb").write(r.content)const q = new URLSearchParams({ access_key: 'YOUR_API_KEY', url: 'https://stripe.com' });
const res = await fetch(`https://api.screenshotneo.com/v1/shot?${q}`);ScreenshotNeo also includes an MCP server with take_screenshot, get_page_info, and capture_pdf tools for Claude, Cursor, and other MCP clients. It supports full-page and element captures, device presets, custom viewports, dark mode, retina scale, PDF settings, custom CSS and JavaScript, clicks, waits, blocked resources, headers, cookies, user agents, timezone, geolocation, transparent backgrounds, resizing, caching, signed links, asynchronous jobs, webhooks, bulk capture, and usage reporting.
There are 1,000 free screenshots per month with no card. Paid plans start at $5 for 3,000 shots. Create a free ScreenshotNeo account.
FAQ
Is Chrome DevTools a separate download?
No. It is built into Google Chrome and opened from the browser menu, a context-menu Inspect command, or a keyboard shortcut.
Can DevTools change my production website?
It can change the page currently loaded in your browser, but those edits are temporary unless you update and deploy the source code.
Which panel should I use for a slow page?
Use Network for request and transfer problems, Performance for runtime CPU and rendering work, and Lighthouse for broader page-load improvement suggestions.
Where can I inspect cookies and service workers?
Open the Application panel. It includes storage, cache data, manifests, and service-worker information.
Can I debug JavaScript without changing the code?
Yes. Console expressions, breakpoints, conditional breakpoints, watch expressions, and the call stack let you inspect execution before making a source change.


