How to Use Agent Browser MCP with Chrome
Set up Chrome DevTools MCP, connect it to a fresh or existing Chrome session, and troubleshoot the browser access choices that matter.
Short answer: “Agent Browser MCP” can refer to two different projects. The agent-browser package and Chrome’s official Chrome DevTools MCP server have different commands. This guide uses Chrome DevTools MCP because its current setup and connection modes are documented by Chrome for Developers.
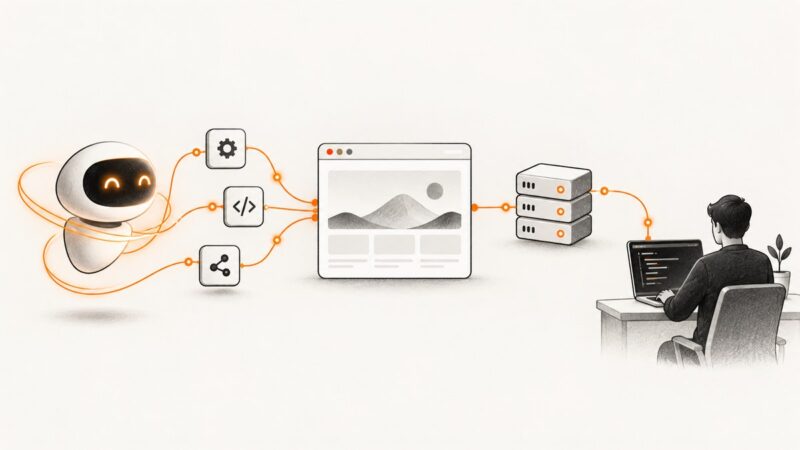
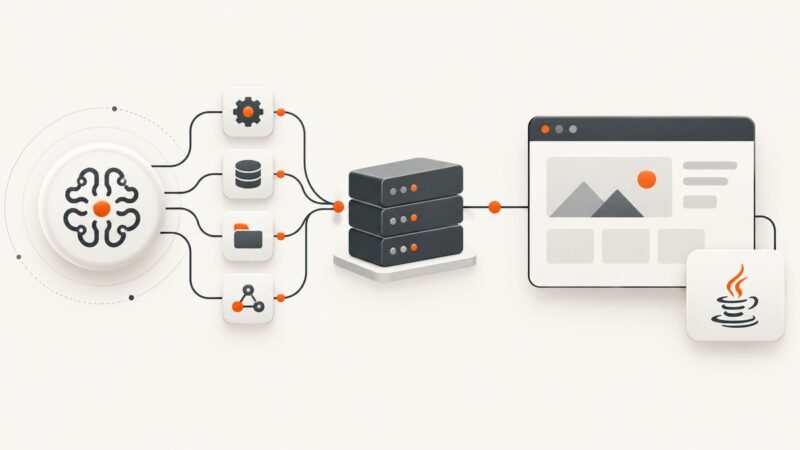
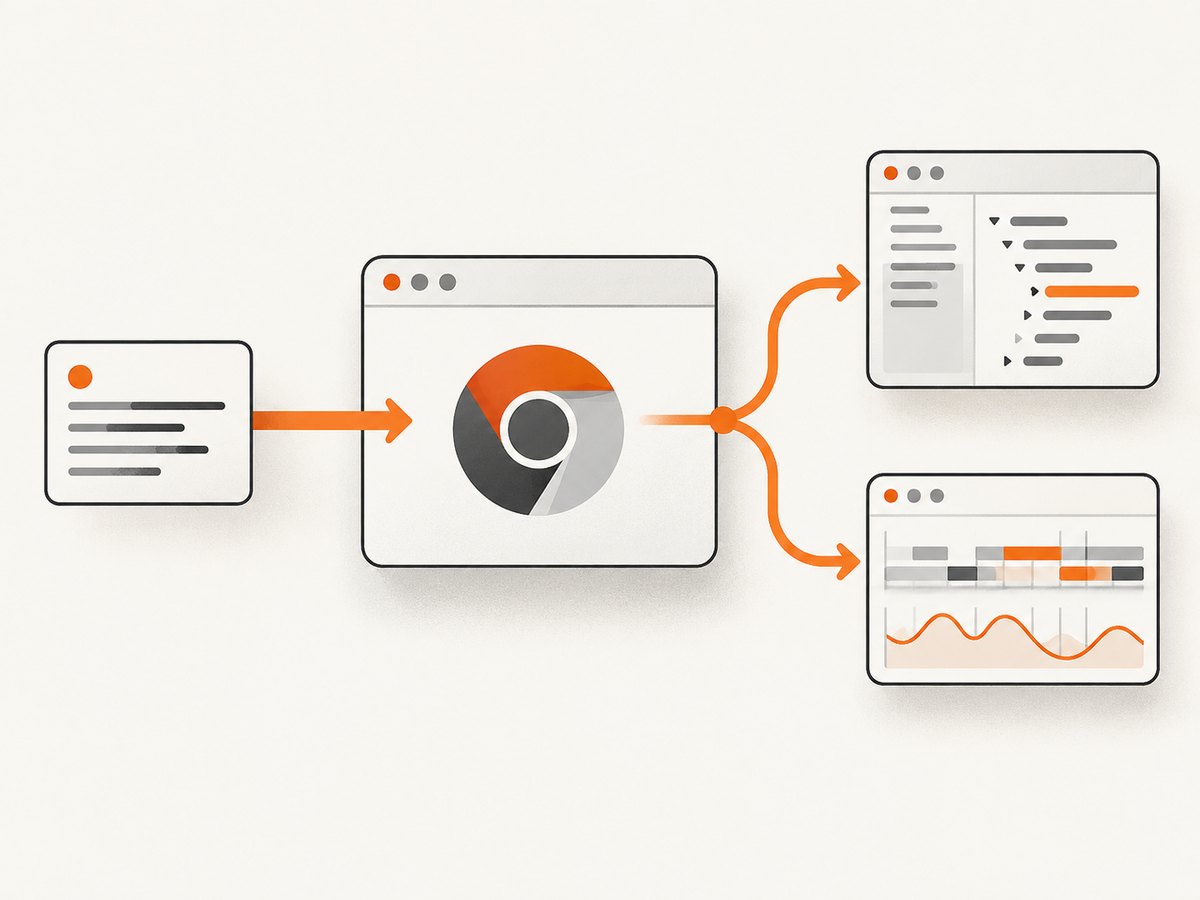
Chrome DevTools MCP lets an MCP client such as Codex, Claude Code, Cursor, Gemini CLI or another compatible agent open Chrome, inspect pages, interact with them and use DevTools capabilities. You can let the server start a fresh browser, run Chrome headless, connect automatically to an existing browser, or connect manually through Chrome’s debugging port.
1. Understand which MCP project you are installing
Search results often mix these names:
| Name | What it is | Command covered here |
|---|---|---|
agent-browser |
A separate browser automation package | Not covered by the Chrome DevTools MCP commands below |
| Chrome DevTools MCP | Chrome’s MCP server for agent access to Chrome and DevTools | npx chrome-devtools-mcp@latest |
Do not substitute an agent-browser installation command for the Chrome DevTools MCP command. If you specifically need the agent-browser package, use that project’s own current documentation.
2. Check the prerequisites
Chrome’s documented prerequisites are:
- Node.js, preferably the latest LTS release
- npm
- Current stable Google Chrome
- An MCP client that can register an MCP server
Check the first two from a terminal:
node --version
npm --version
Also confirm that Chrome opens normally before adding MCP. If you use a managed computer, an administrator policy may restrict debugging, profiles or extensions.
3. Register Chrome DevTools MCP with Codex
For Codex, Chrome documents this registration command:
codex mcp add chrome-devtools -- npx chrome-devtools-mcp@latestThe command tells Codex to run the package through npx. The @latest tag requests the current published package when the server starts.
Configuration for clients that use mcpServers
Some MCP clients use a JSON configuration instead of a registration command. Chrome’s guide shows this shape:
{
  "mcpServers": {
    "chrome-devtools": {
      "command": "npx",
      "args": ["-y", "chrome-devtools-mcp@latest"]
    }
  }
}
The exact file location and reload action depend on the client. Follow that client’s current MCP configuration instructions if its schema differs.
4. Choose how Chrome starts
By default, the server starts a new Chrome instance. This is the simplest choice for a clean, reproducible session.
Visible Chrome
Use the default launch when you want to watch the agent navigate, inspect pages or approve an interaction yourself.
Headless Chrome
Add --headless when no visible window is needed:
npx chrome-devtools-mcp@latest --headlessWhen using a client configuration, add the flag to args:
{
  "mcpServers": {
    "chrome-devtools": {
      "command": "npx",
      "args": ["-y", "chrome-devtools-mcp@latest", "--headless"]
    }
  }
}
Chrome DevTools MCP also supports launch configuration such as the Chrome channel, executable path, profile directory, viewport and other browser options. Keep those options with the server command used by your client, and verify the current flag names in Chrome’s configuration documentation because they can change.
5. Connect to an existing Chrome session
An existing session is useful when a page is already open or when the task needs a signed-in account. It also changes the security model: the agent can see browser content, cookies and account data available to that session.
Option A: automatic connection
Automatic connection uses --autoConnect. Chrome documents these requirements:
- Chrome 144 or later
- Remote Debugging enabled in
chrome://inspect/#remote-debugging - Approval of Chrome’s connection prompt
Start the MCP server with:
npx chrome-devtools-mcp@latest --autoConnectOpen chrome://inspect/#remote-debugging in Chrome, enable the remote debugging setting, and approve the prompt when Chrome asks whether the agent may connect.
Option B: manual debugging-port connection
Manual mode starts Chrome with a debugging port, then points MCP at that port. The MCP argument is:
--browser-url=http://127.0.0.1:9222A typical manual flow is:
- Start a separate Chrome process with remote debugging enabled and a separate user-data directory.
- Keep the debugging port at
9222, or choose another unused port. - Start Chrome DevTools MCP with a matching
--browser-url.
Use the same port in both commands. If you choose another port, replace 9222 everywhere.
Chrome’s configuration documentation shows using a custom user-data directory for manually launched Chrome. A separate directory prevents accidental reuse of your normal profile and makes the session easier to discard after the task.
6. Run a smoke test
After registration, ask your MCP client to open https://developers.chrome.com and check the page’s performance. Chrome’s documentation uses this as a setup example: the expected action is for the agent to open a browser and record a performance trace.
This prompt verifies that the client can start or reach Chrome and that the MCP tools respond. It is a setup smoke test, not a performance benchmark for your own machine or website.
7. Use a repeatable workflow
- Start with a fresh session. Use the default launch for public pages and tasks that do not need login state.
- Choose headless mode for automation. Remove the visible window when an operator does not need to watch the run.
- Use an existing session only when required. This is appropriate for a page that is already open or an account that must remain signed in.
- Ask the agent to confirm the target. Have it report the URL, title and key page state before making changes.
- Separate inspection from modification. For a risky task, first ask for a read-only description, then approve the action explicitly.
- Save useful evidence. Request a trace, console output, screenshots or a clear summary when debugging.
8. Security and profile isolation
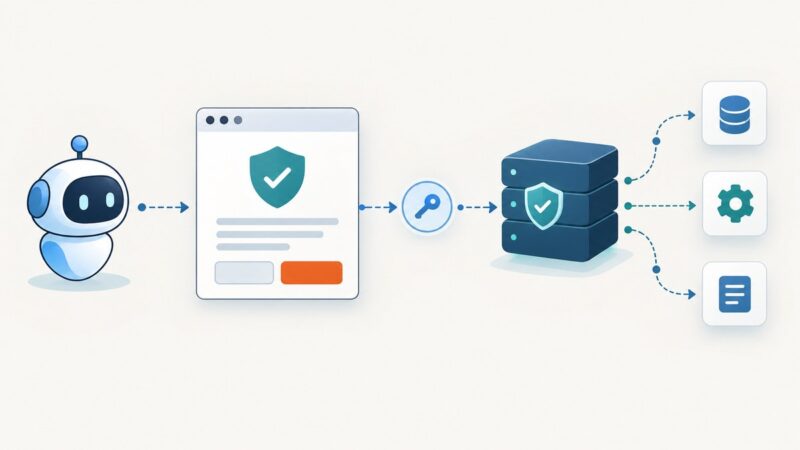
Chrome’s security warning is direct: “Chrome DevTools for agents exposes your browser content to your agent. This allows the agent to read, inspect, debug, and modify any data in the browser or DevTools.”
Connecting to an existing session can expose:
- Pages open in that browser
- Logged-in accounts and their visible data
- Cookies and session state available to the browser
- Form fields, local storage and DevTools information
Use an agent and MCP client you trust. For tasks that do not need your normal accounts, use a separate Chrome profile or an isolated temporary user-data directory. Chrome documents an isolated temporary user-data option, but treat it as separation for the task rather than a guarantee that every security risk disappears.
9. Troubleshooting
| Symptom | Likely cause | Fix |
|---|---|---|
npx or node is not found |
Node.js or npm is missing, or not on PATH |
Install the latest Node.js LTS, open a new terminal and recheck node --version and npm --version. |
| The MCP client cannot start the server | Invalid client configuration or a stale client process | Check that the command is npx and the argument is chrome-devtools-mcp@latest; reload or restart the MCP client. |
| Chrome never opens | Chrome is not installed, is blocked by policy, or the executable path is wrong | Open Chrome manually, then configure the correct channel or executable path in the server launch options. |
| Automatic connection does nothing | Chrome is older than 144, remote debugging is disabled, or the approval prompt was declined | Update Chrome, enable remote debugging at chrome://inspect/#remote-debugging, and approve the connection. |
| Manual connection fails | The MCP URL and Chrome debugging port do not match | Use the same port in Chrome’s launch command and --browser-url=http://127.0.0.1:PORT. Confirm that another process is not using it. |
| The agent sees the wrong tabs | It connected to your normal profile or an already-running browser | Close unrelated windows and use a dedicated profile or custom user-data directory. |
| Login state is missing | The server started a fresh profile | Use an existing-session connection, or sign in within the dedicated profile. Do not copy private profile data casually. |
| Headless mode behaves differently | A page depends on visible UI, permissions or timing | Reproduce the task in visible mode first, then add waits and switch to headless after the workflow is stable. |
| The smoke-test trace is empty | The page did not finish loading or the agent did not record the trace action | Ask the agent to open the URL, wait for the page, then explicitly start and stop a performance trace. |
10. Performance, reliability and cost considerations
Performance
- A fresh Chrome startup adds work to every run; reuse a controlled session when startup dominates the task.
- Headless mode removes the visible window, but it does not guarantee that every page behaves identically to a visible session.
- Use a viewport and browser channel that match the page you are investigating.
- For debugging, capture a trace around the slow action instead of tracing unrelated setup time.
Reliability
- Pin your operational process to a known Chrome and Node.js environment when repeatability matters.
- Use a dedicated profile so extensions, tabs and login state do not change unexpectedly.
- Keep automatic and manual connection modes separate in scripts so a failed attach does not silently target another browser.
- Recheck Chrome’s current MCP flags before publishing or deploying a long-lived setup; the documentation and compatibility requirements can change.
Cost
Chrome DevTools MCP is a local setup that runs through Node.js and Chrome. Your practical costs are the machine, browser runtime and any hosted model or MCP client you choose. The dossier provides no benchmark or fixed runtime price, so measure your own workflow if resource usage matters.
11. Or skip the browser setup
If your goal is a clean image or PDF of a URL rather than interactive browser debugging, ScreenshotNeo provides a website screenshot API and MCP server. It accepts one GET request and returns PNG, JPEG, WebP or PDF.
Use the API directly (see the ScreenshotNeo API documentation):
cURL
curl -G "https://api.screenshotneo.com/v1/shot" -d access_key=YOUR_API_KEY --data-urlencode url=https://stripe.com -o shot.webpPython
import requests
r = requests.get("https://api.screenshotneo.com/v1/shot", params={"access_key": "YOUR_API_KEY", "url": "https://stripe.com"}, timeout=90)
open("shot.webp", "wb").write(r.content)
Node.js
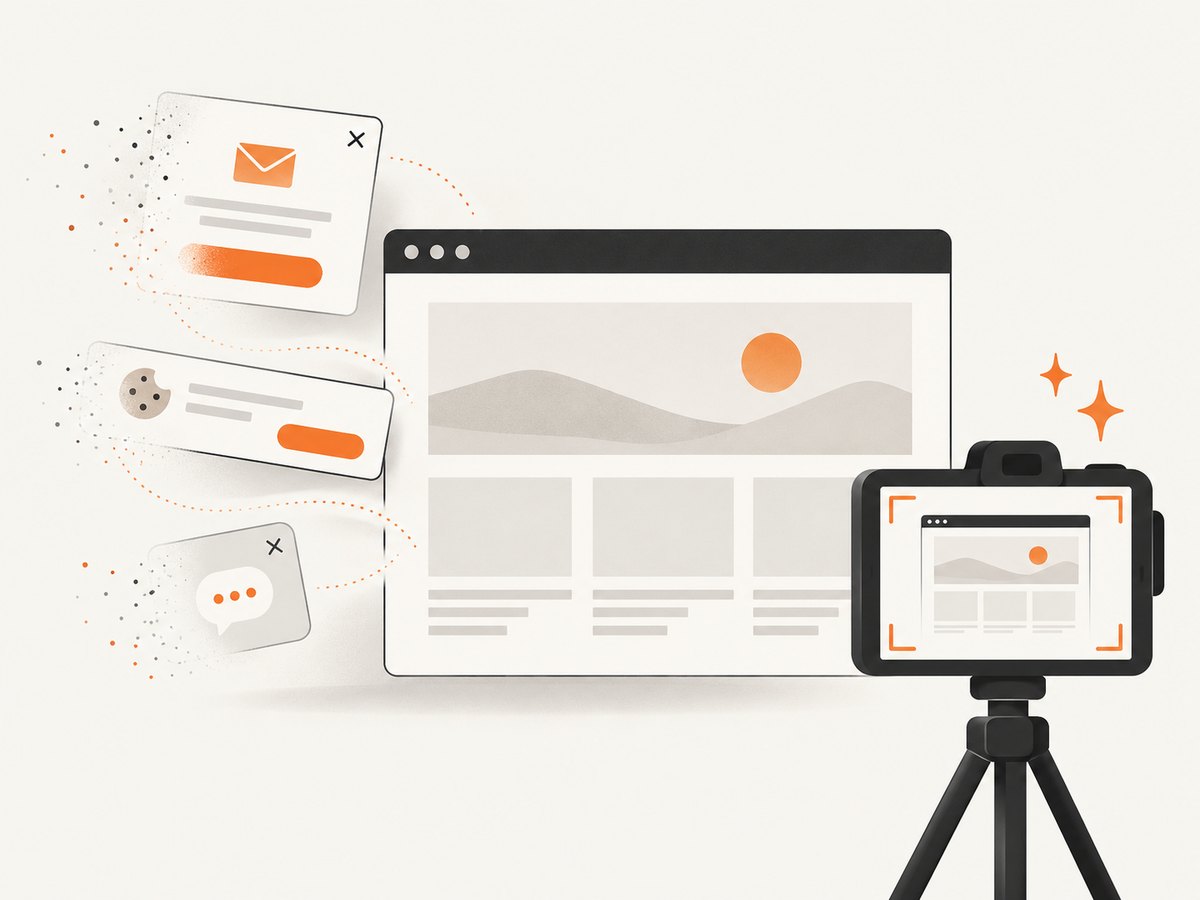
const q = new URLSearchParams({ access_key: 'YOUR_API_KEY', url: 'https://stripe.com' }); const res = await fetch(`https://api.screenshotneo.com/v1/shot?${q}`);ScreenshotNeo removes cookie and consent banners, newsletter popups and chat widgets before capture. Bot checks, blank pages, failed loads, timeouts and cache hits are not billed, and response headers identify the page verdict and whether it was billed. Its MCP server includes take_screenshot, get_page_info and capture_pdf tools for Claude, Cursor and other MCP clients.
It includes full-page capture with lazy images loaded, CSS-selector element capture, dark mode, device presets and custom viewports, retina scale, PDF paper sizes and margins, custom CSS and JavaScript, clicks, selector waits, delays, network-idle waits, request and resource blocking, headers, cookies, user agents, authorization, timezone, geolocation, transparent backgrounds, resizing, configurable caching, signed image links, asynchronous jobs with signed webhooks, bulk capture for up to 100 URLs per call, a usage API and an OpenAPI specification.
Plans include 1,000 screenshots per month free with no card. Paid plans start at $5 for 3,000 shots; every feature is on every plan. Create a free ScreenshotNeo account.
12. FAQ
Is Agent Browser MCP the same as Chrome DevTools MCP?
No. They are separate projects. This guide covers Chrome DevTools MCP and its chrome-devtools-mcp@latest package.
Can I use my existing Chrome login?
Yes, with automatic or manual existing-session connection, but the agent then has access to data visible in that session. Prefer a dedicated profile when the task does not require your normal account.
Do I need Chrome 144 for every setup?
No. Chrome 144 or later is the documented requirement for automatic connection with --autoConnect. A fresh browser launch and manual debugging-port connection have different setup requirements.
Should I use headless mode?
Use visible mode while developing or diagnosing a workflow. Move to headless mode when the task is stable and no operator needs to watch Chrome.
Can ScreenshotNeo replace Chrome DevTools MCP?
It replaces the browser setup for URL screenshots and PDFs. Chrome DevTools MCP remains the better fit for interactive inspection, debugging and actions inside a live browser session.