How to Benchmark Puppeteer Performance
Learn how to benchmark Puppeteer with repeatable timings, browser metrics, traces, and a practical workflow for finding real bottlenecks.

Direct answer: benchmark Puppeteer by defining one representative browser task, fixing the browser and machine conditions, timing the exact start and end points with a monotonic clock, repeating the task, and reporting the distribution instead of one run. Use page.metrics() and a Chrome trace to explain slow runs, but keep diagnostic runs separate from the headline timing whenever instrumentation could change the workload.
This method tells you whether a navigation, interaction, or rendering workflow changed under comparable conditions. It does not produce a universal “Puppeteer speed” number. A result is meaningful only when the task, readiness condition, browser build, cache state, network, throttling, and concurrency are documented.
1. Define exactly what you are measuring
Start by writing a one-sentence benchmark contract. For example:
Measure the elapsed time from page.goto() until the product table is visible, using a warm cache, headless Chromium, and one browser tab.Choose a workload that represents the question you need to answer:
- Navigation: issue
page.goto()and wait for a defined readiness signal. - Interaction: click, type, or submit a form and stop when the resulting UI state is stable.
- Rendering: load data, render a component, or generate a PDF or screenshot.
- End-to-end workflow: include browser startup, navigation, actions, and output when that is the production path.
Do not compare a run waiting for load with another run waiting for a selector or application-specific completion. Those are different experiments. Record whether your result measures website work, Puppeteer orchestration, browser startup, or all three.
2. Pin and report the environment
Keep the following values fixed within a comparison and print them with every benchmark result:
| Dimension | What to record | Why it matters |
|---|---|---|
| Software | Puppeteer version and browser version or revision | Puppeteer releases are bundled with browser revisions to preserve protocol compatibility. Replacing the bundled browser is your responsibility. |
| Machine | OS, CPU class, memory, power mode, and background load | CPU contention and thermal throttling change timings. |
| Browser mode | Headless or headful, viewport, device scale factor | Rendering paths and pixel work can differ. |
| Storage | Cold profile, cleared storage, or warm cache | First visits and repeat visits exercise different code and network paths. |
| Network | Connection, proxy, DNS, and any request blocking | Remote resources often dominate wall-clock time. |
| Load | Number of parallel pages, workers, and other jobs | Concurrency can make a browser or host CPU bound. |
| Throttling | Exact CPU and network throttle settings | DevTools CPU throttling is relative to the host; it is not an exact simulation of a phone. |
Use a clean browser profile and avoid extensions or unrelated CPU-heavy processes. Decide before collecting data whether warm-up runs are included. If you clear storage for a cold-cache test, do it for every run; if you preserve storage for a repeat-visit test, preserve it consistently.
3. Build a repeatable Puppeteer harness
The following Node.js program runs a navigation benchmark, records end-to-end time, collects browser metrics, and writes JSON you can analyze later. Install Puppeteer with npm install puppeteer.
import puppeteer from 'puppeteer';
import { performance } from 'node:perf_hooks';
import { writeFile } from 'node:fs/promises';

const URL = process.env.BENCHMARK_URL || 'https://example.com';
const RUNS = Number(process.env.RUNS || 10);
const READY_SELECTOR = process.env.READY_SELECTOR || 'body';

function summarize(values) {
  const sorted = [...values].sort((a, b) => a - b);
  const percentile = (p) => sorted[Math.min(sorted.length - 1, Math.floor((sorted.length - 1) * p))];
  const mean = values.reduce((sum, value) => sum + value, 0) / values.length;
  return {
    count: values.length,
    min_ms: sorted[0],
    median_ms: percentile(0.5),
    p90_ms: percentile(0.9),
    max_ms: sorted[sorted.length - 1],
    mean_ms: mean
  };
}

const browser = await puppeteer.launch({ headless: true });
const browserVersion = await browser.version();
const durations = [];
const diagnostics = [];

try {
  for (let run = 0; run < RUNS; run += 1) {
    const page = await browser.newPage();
    await page.setViewport({ width: 1280, height: 800, deviceScaleFactor: 1 });

    const start = performance.now();
    await page.goto(URL, { waitUntil: 'domcontentloaded', timeout: 90000 });
    await page.waitForSelector(READY_SELECTOR, { visible: true, timeout: 90000 });
    const elapsed = performance.now() - start;

    const metrics = await page.metrics();
    durations.push(Number(elapsed.toFixed(2)));
    diagnostics.push({ run: run + 1, elapsed_ms: Number(elapsed.toFixed(2)), metrics });
    await page.close();
  }
} finally {
  await browser.close();
}

const result = {
  url: URL,
  browser: browserVersion,
  runs: summarize(durations),
  samples: diagnostics
};

console.log(JSON.stringify(result, null, 2));
await writeFile('puppeteer-benchmark.json', JSON.stringify(result, null, 2));
The timer surrounds only the operation being compared. If browser startup is part of your production path, create a second benchmark that includes puppeteer.launch(); do not mix startup and warm-browser measurements in one number.
4. Choose readiness and timing boundaries carefully
waitUntil: 'load' means the load event fired. 'domcontentloaded' stops earlier, after the document has been parsed. Neither guarantees that an application finished fetching data or that a meaningful control is usable. A selector, an application-specific marker, or a page-side promise is often a better end condition.
await page.goto(url, { waitUntil: 'domcontentloaded', timeout: 90000 });
await page.waitForSelector('[data-test="results-ready"]', {
  visible: true,
  timeout: 90000
});
For a stable interaction, time from the action to a verifiable state:
const start = performance.now();
await page.click('[data-test="search"]');
await page.waitForSelector('[data-test="results-ready"]', { visible: true });
const interactionMs = performance.now() - start;
Use a Node-side high-resolution timer for end-to-end duration. You can also add User Timing marks in the page when correlating application phases with a trace:
await page.evaluate(() => performance.mark('benchmark-start'));
// perform the operation
await page.evaluate(() => performance.mark('benchmark-end'));
const measure = await page.evaluate(() => {
  performance.measure('benchmark-task', 'benchmark-start', 'benchmark-end');
  return performance.getEntriesByName('benchmark-task')[0].duration;
});
5. Collect Puppeteer metrics without mistaking them for speed
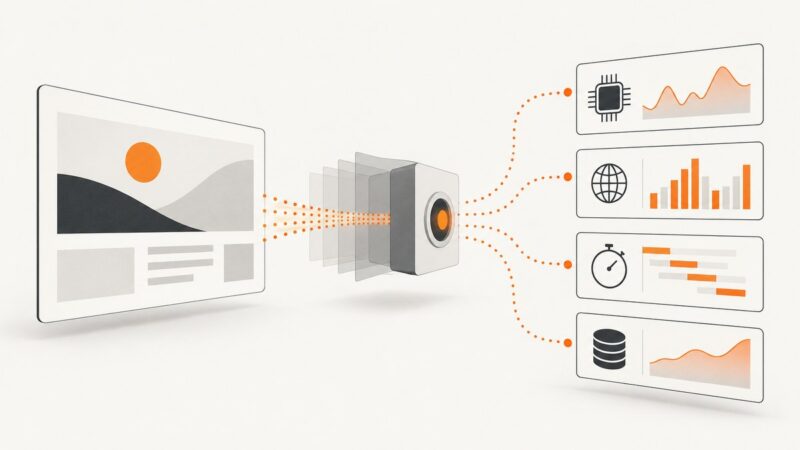
page.metrics() exposes browser-reported diagnostics such as TaskDuration, ScriptDuration, LayoutDuration, RecalcStyleDuration, Documents, Frames, JSEventListeners, Nodes, LayoutCount, RecalcStyleCount, JSHeapTotalSize, and JSHeapUsedSize. Some fields are optional.
| Measurement | Answers | Limit |
|---|---|---|
| End-to-end elapsed time | How long your chosen workflow took | Depends on boundaries, machine, network, and cache. |
TaskDuration |
How much cumulative browser task time was reported | It is not wall-clock test duration. |
ScriptDuration |
How much JavaScript execution accumulated | Interpret with the workload and trace. |
LayoutDuration and RecalcStyleDuration |
Time spent in layout and style recalculation | They do not identify the responsible code alone. |
| DOM counts and heap sizes | Structural and memory indicators | Counts are not direct measures of user-perceived speed. |
The Timestamp metric is monotonic seconds from an arbitrary point, not a wall-clock date. Compare like with like and keep the raw samples so another engineer can inspect outliers.
6. Repeat runs and summarize the distribution
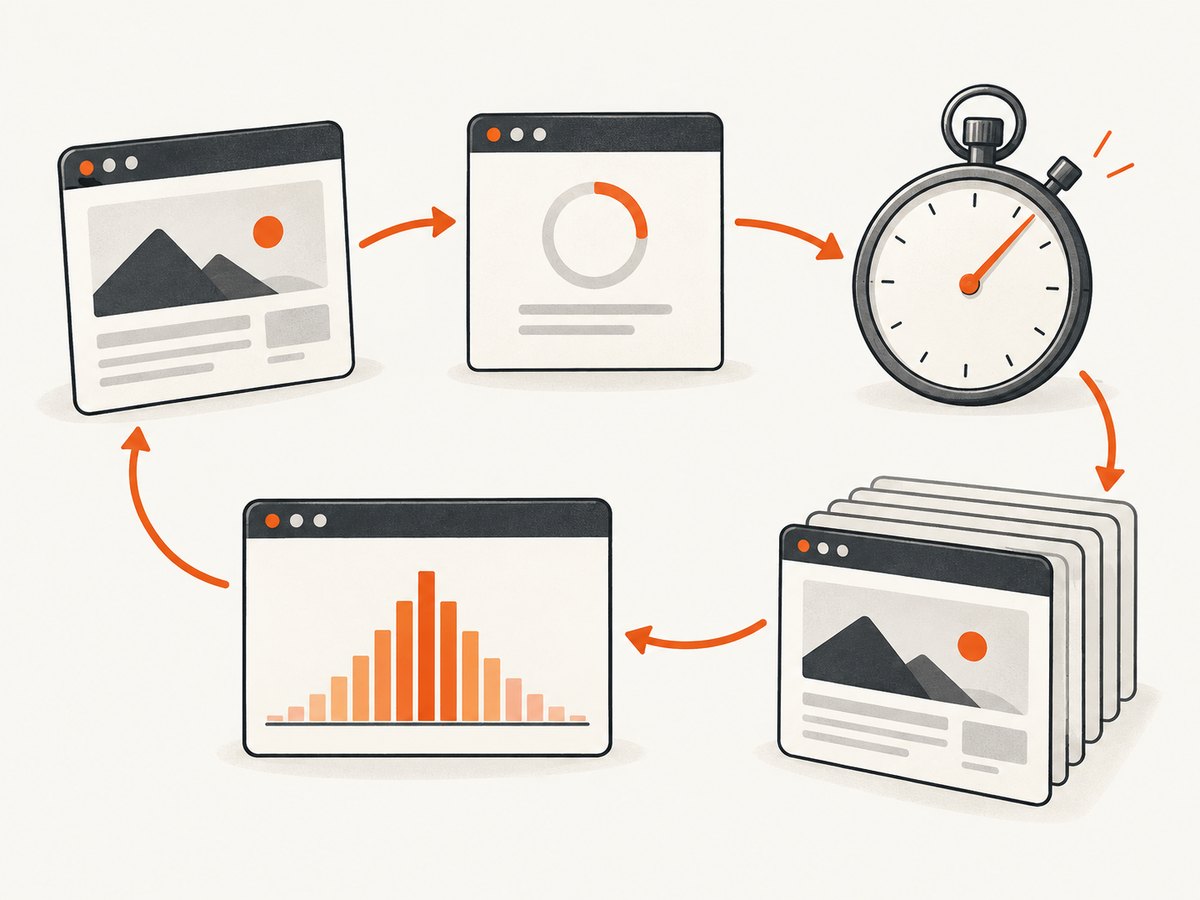
Run enough repetitions to expose variability, then state the run count and statistic in your report. There is no universal Puppeteer run count or official required summary statistic. A practical report includes median, p90, minimum, maximum, and the raw values. The median describes a typical run; p90 shows the slower tail. The fastest run alone is usually the least useful result.
Define invalid-run rules before looking at results. For example, a navigation timeout may be recorded as a failure rather than silently removed. If you exclude a warm-up, exclude it by a predeclared rule for every comparison. Report failures separately from successful durations.
7. Use tracing to explain a change
When a timing changes, capture a diagnostic trace around the same operation. Puppeteer tracing can return trace bytes or write a file that you open in Chrome DevTools or a timeline viewer. Only one trace can be active per browser.
await page.tracing.start({
  path: 'trace.json',
  screenshots: false,
  categories: ['devtools.timeline', 'disabled-by-default-devtools.timeline']
});

const start = performance.now();
await page.goto(URL, { waitUntil: 'domcontentloaded', timeout: 90000 });
await page.waitForSelector(READY_SELECTOR, { visible: true, timeout: 90000 });
const elapsed = performance.now() - start;

await page.tracing.stop();
console.log({ elapsed_ms: elapsed });
Inspect scripting, rendering, network, and idle intervals in the trace. Keep profiled runs separate from headline runs because tracing and screenshots can add work. The Puppeteer tracing API documents category and output options. Chrome’s Performance panel documentation explains recordings, User Timing marks, and throttling.
8. Compare the right axes
- Cold versus warm: clearing storage represents a first visit; preserving it represents a repeat visit.
- Headless versus headful: hold the mode constant unless the mode itself is the question.
- Unthrottled versus throttled: publish exact CPU and network settings and remember that CPU throttling is host-relative.
- One tab versus parallel pages: concurrency changes CPU, memory, and network contention.
- Raw versus profiled: use raw runs for the headline number and traces for diagnosis.
- Automation stacks: compare the same language/runtime, browser, readiness condition, and workflow. Puppeteer is a Node.js library; Selenium supports more languages and orchestration options, but neither fact establishes which is faster for your workload.
Puppeteer’s FAQ describes “almost zero performance overhead over an automated page” as a project speed principle. Treat that as a stated goal, not a measured guarantee for every site or script.
9. Troubleshooting common benchmark errors
| Symptom | Likely cause | Fix |
|---|---|---|
| Large run-to-run swings | Background CPU load, extensions, shared CI host, or network variability | Use a clean profile, isolate the worker, document concurrency, and repeat the test. |
| Timeouts on apparently fast pages | The readiness selector never appears, or the page waits on a blocked third-party request | Choose a correct application-ready condition, inspect console/network errors, and set an explicit timeout. |
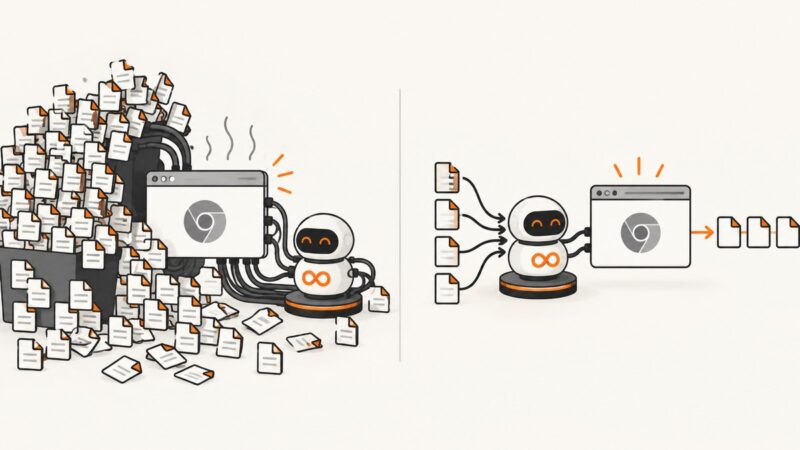
| First run is much slower | Browser startup, compilation, DNS, or cold cache | Separate startup and warm-browser benchmarks; decide whether warm-up runs are excluded before collecting data. |
| Metrics look high but elapsed time is low | Metrics are cumulative browser work, not wall-clock duration | Use the monotonic elapsed timer as the outcome and metrics as diagnostics. |
| Trace cannot start | A trace is already active on that browser | Stop the existing trace before starting another, or use a separate browser instance. |
| Results changed after a Puppeteer upgrade | The bundled browser revision or protocol behavior changed | Record both versions and rerun the complete baseline under the new environment. |
| Headless and headful numbers disagree | Different rendering and compositing paths | Compare within one mode and report the mode explicitly. |
| CI is slower than a laptop | Different CPU, virtualization, thermal limits, or parallel jobs | Use a consistent runner class and avoid comparing absolute values across machines without qualification. |
10. Performance, reliability, and cost considerations
For performance, reduce uncontrolled work before optimizing code: reuse a browser when measuring page tasks, keep page count explicit, avoid unnecessary screenshots during timing, and block only the same resources in every compared run. A request-blocking rule can make a test faster while changing the workload, so treat it as a separate benchmark variant.
For reliability, record failures and timeouts rather than hiding them. Save the URL, run number, browser version, environment, error message, and elapsed time. A benchmark that reports only successful runs can make a flaky workflow appear fast.
For cost, local Puppeteer runs consume your own compute and network resources. If your real requirement is repeatable website screenshots rather than browser orchestration, an API can remove the browser maintenance from the capture path.
Or skip the browser setup
ScreenshotNeo provides a website screenshot API at https://api.screenshotneo.com/v1/shot. You can still benchmark your own Puppeteer workflow when that is the experiment, then use ScreenshotNeo when the production task is simply “return a clean screenshot.” Before capture it accepts cookie and consent banners and removes more than 60 known consent platforms, newsletter popups, and chat widgets; each step can be turned off. Bot checks and CAPTCHAs, blank pages, timeouts, failed loads, and cache hits are not billed, and response headers identify the page verdict and billing status.
See the complete option list and parameter details in the ScreenshotNeo documentation.
cURL
curl -G "https://api.screenshotneo.com/v1/shot" \
  -d access_key=YOUR_API_KEY \
  --data-urlencode url=https://stripe.com \
  -o shot.webp
Python
import requests

r = requests.get(
    "https://api.screenshotneo.com/v1/shot",
    params={"access_key": "YOUR_API_KEY", "url": "https://stripe.com"},
    timeout=90,
)
r.raise_for_status()
open("shot.webp", "wb").write(r.content)
Node.js
const q = new URLSearchParams({ access_key: 'YOUR_API_KEY', url: 'https://stripe.com' });
const res = await fetch(`https://api.screenshotneo.com/v1/shot?${q}`);
if (!res.ok) throw new Error(`Screenshot failed: ${res.status}`);
const image = Buffer.from(await res.arrayBuffer());
await import('node:fs/promises').then(fs => fs.writeFile('shot.webp', image));
ScreenshotNeo also supports full-page capture with lazy images loaded, element selectors, dark mode, device presets and custom viewports, retina scale, PDFs, custom CSS and JavaScript, clicks, waits, resource blocking, headers, cookies, user agents, authorization, timezone, geolocation, transparent backgrounds, resizing, caching with a chosen TTL, signed links, asynchronous jobs with signed webhooks, bulk capture of up to 100 URLs per call, a usage API, and an OpenAPI specification. An MCP server provides take_screenshot, get_page_info, and capture_pdf tools for Claude, Cursor, and other MCP clients.
The Free plan includes 1,000 shots each month with no card. Paid plans start at $5 for 3,000 shots; yearly billing gives two months free, and every feature is available on every plan. Create a free ScreenshotNeo account to try the API with 1,000 screenshots a month and no card.
FAQ
How many Puppeteer runs should I execute?
There is no official universal count. Run enough to reveal variability, state the count, and publish the distribution and raw samples.
Should I use page.metrics() as my score?
No. Use a monotonic elapsed timer for the task outcome. Use metrics to explain browser work and compare like-for-like runs.
Does a trace make the benchmark invalid?
Tracing is valuable for diagnosis, but instrumentation can affect timing. Keep traced runs separate from headline measurements.
Is CPU throttling a mobile benchmark?
No. DevTools throttling is relative to the host machine and cannot reproduce a phone’s architecture exactly. Report the setting and machine.
Can I compare two Puppeteer versions directly?
Yes, if the task and environment are held constant and both Puppeteer and browser versions are recorded. Treat browser revision changes as part of the experiment.