How to Measure Browser Performance with Headless Browsers
Measure headless browser performance reproducibly with Puppeteer, Lighthouse, traces, User Timing, controlled workloads, and repeatable CI runs.
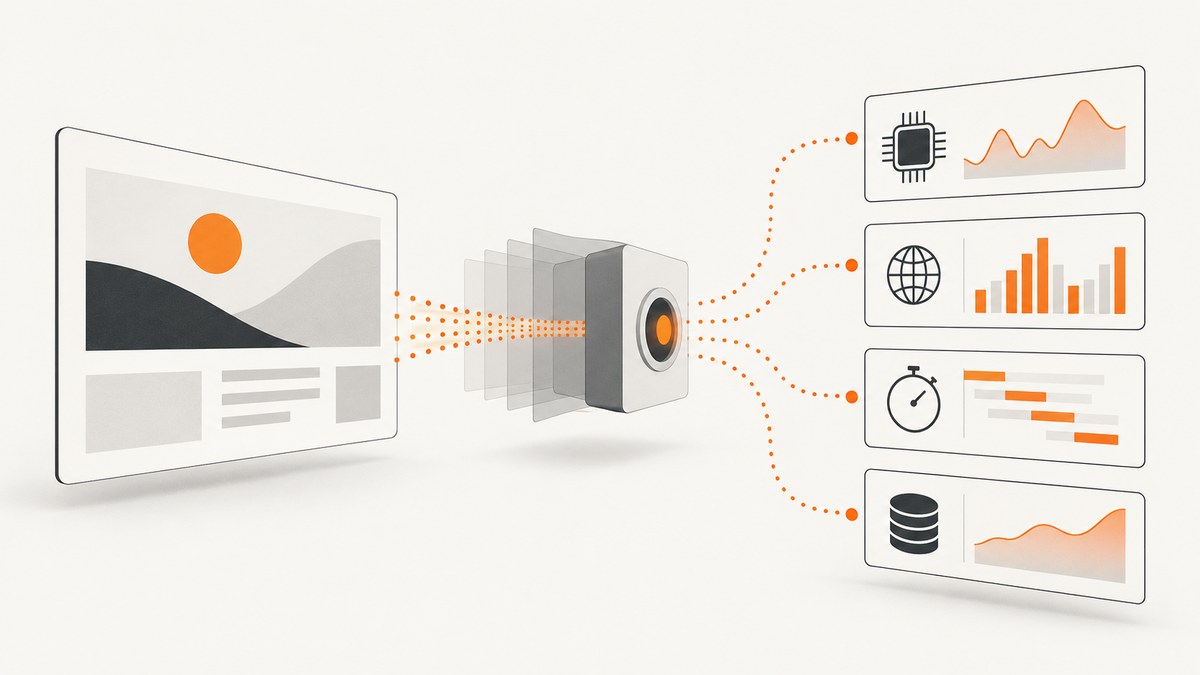
Short answer: measure a defined workload in a pinned browser and host environment, repeat it enough to see noise, save raw metrics and traces, and compare distributions rather than one score. Use Lighthouse for automated page-load audits, Chrome Performance traces for runtime diagnosis, and User Timing marks for application-specific milestones. Headless mode makes automation easier; it does not make a result representative of every user’s device or network.
Chrome’s current documentation says that unified Headless and headful modes share Chrome code. Since Chrome 132.0.6793.0, the older implementation is available separately as chrome-headless-shell. Puppeteer exposes these choices as headless: true (current Headless), headless: 'shell' (Headless Shell), and headless: false (headful). Record the mode you use; do not silently combine results from different modes. See Chrome’s Headless documentation and Puppeteer’s headless-mode guide.
1. Define the question before choosing a tool
| Question | Tool | Useful output |
|---|---|---|
| How fast is a navigation for a specified device and network? | Lighthouse | Audited metrics, opportunities, diagnostics, and a report artifact |
| Why did an interaction or page become slow? | Chrome Performance trace | Chronological CPU, network, rendering, FPS, and main-thread activity |
| How long does an application phase take? | User Timing | Custom performance.mark() and performance.measure() intervals in trace/report data |
Separate page-load tests from runtime tests. A navigation audit answers a different question from opening a menu repeatedly, scrolling through a feed, or measuring a sustained animation. Write down the URL, authentication state, data set, actions, waits, viewport, and success condition before you automate.

2. Pin and report the environment
A headless result is a measurement of a particular browser build, host, page state, and workload. Record at least:
- Browser name, exact version, and headless mode.
- Operating-system or container image, CPU allocation, memory limit, and launch flags.
- Viewport dimensions, device scale factor, and whether the test is desktop or mobile emulation.
- URL, authentication, feature flags, test data, interactions, and wait conditions.
- Cold or warm cache, cookies, local storage, service workers, and whether storage is cleared.
- Network route, latency/bandwidth settings, CPU throttling method, and timezone or geolocation if relevant.
- Lighthouse, Puppeteer, Playwright, and Node/Python versions.
- Raw metric values, trace files, and the run timestamp.
Lighthouse documents variation from device differences, network routing, browser extensions, antivirus software, and A/B tests. Treat this manifest as a reproducibility practice inferred from those documented controls, not as a universal standard.
3. Choose cache and page-state semantics
Decide whether the workload represents a first visit or a repeat visit. For a first visit, clear cookies, storage, service workers, and cache consistently. For a repeat visit, warm the page using the same number of visits and preserve the same state for every run. Never compare a cold run with a warm run and call the difference a code change.
Keep authentication and data stable. A redirect to login, an empty account, a personalized recommendation, or a rotating advertisement can change both the workload and the result. If the page depends on an API, make the test data deterministic or record the response conditions.
4. Run a repeatable Puppeteer navigation measurement
Install Puppeteer with Node.js:
npm install puppeteerThis script records navigation timing, paint entries, resource count, and a trace. It uses current unified Headless mode; change headless to 'shell' or false only when that is the workload you intend to measure.
const puppeteer = require('puppeteer');

(async () => {
  const browser = await puppeteer.launch({
    headless: true,
    args: ['--no-sandbox', '--disable-dev-shm-usage']
  });
  const page = await browser.newPage();
  await page.setViewport({ width: 1365, height: 768, deviceScaleFactor: 1 });

  // For a cold-visit protocol, clear state before every run.
  await page.setCacheEnabled(false);
  await page.setExtraHTTPHeaders({ 'Cache-Control': 'no-cache' });

  await page.tracing.start({ path: 'trace.json', screenshots: false });
  const start = Date.now();
  await page.goto('https://example.com', { waitUntil: 'networkidle0', timeout: 90000 });
  const navigationMs = Date.now() - start;

  const metrics = await page.evaluate(() => ({
    navigation: performance.getEntriesByType('navigation')[0].toJSON(),
    paints: performance.getEntriesByType('paint').map(entry => entry.toJSON()),
    resources: performance.getEntriesByType('resource').length
  }));
  await page.tracing.stop();
  console.log(JSON.stringify({ navigationMs, ...metrics }, null, 2));
  await browser.close();
})();
networkidle0 means no active network connections at the observation point; pages with analytics, polling, WebSockets, or ads may never reach a stable idle state. In those cases wait for a meaningful selector plus a bounded delay, or use a documented application-ready mark.
5. Add application-specific User Timing
Built-in navigation metrics may not describe the action users care about. Add marks around the operation and measure it in the page:
performance.mark('search-start');
awaitSearchResults();
performance.mark('search-results-visible');
performance.measure('search-to-results', 'search-start', 'search-results-visible');
In Puppeteer, read those measures after the action:
const measures = await page.evaluate(() =>
  performance.getEntriesByName('search-to-results').map(entry => ({
    name: entry.name,
    duration: entry.duration,
    startTime: entry.startTime
  }))
);
console.log(measures);
Chrome documents extracting User Timing from trace data in its User Timing guidance. Use a stable mark definition and include the mark names in your test report.
6. Use Lighthouse for page-load audits
Install and run Lighthouse against the exact URL and conditions you want to compare:
npm install --save-dev lighthouse
npx lighthouse https://example.com \
  --output=html --output-path=./reports/example.html \
  --quiet
Save the JSON output when you need machine-readable values:
npx lighthouse https://example.com \
  --output=json --output-path=./reports/example.json \
  --quiet
Include the Lighthouse version and raw metric values with any score. Categories, scoring weights, and distributions can change over time, so a score without its version and inputs is difficult to interpret. Lighthouse’s tutorial distinguishes simulated throttling, which extrapolates results, from DevTools throttling, which applies CPU and network limits and takes longer. State which one you used, and do not describe emulation as a physical mobile-device test.
7. Capture and inspect a Performance trace
Use a trace when a metric changes and you need a mechanism. In Puppeteer:
await page.tracing.start({
  path: 'interaction-trace.json',
  screenshots: true,
  categories: [
    'devtools.timeline',
    'disabled-by-default-devtools.timeline',
    'disabled-by-default-v8.cpu_profiler'
  ]
});
await page.click('[data-test="open-menu"]');
await page.waitForSelector('[data-test="menu"]', { visible: true });
await page.tracing.stop();
Open the trace in Chrome DevTools and inspect the CPU and main-thread tracks for script, style, layout, paint, and rendering work. FPS matters when the workload includes animation. The Performance monitor can show CPU, heap, DOM nodes, listeners, frames, layout, and style recalculations while the page is active. See Analyze runtime performance.
8. Python option with Playwright
For teams using Python, install Playwright and its browser:
python -m pip install playwright
python -m playwright install chromium
from time import perf_counter
from playwright.sync_api import sync_playwright
with sync_playwright() as p:
browser = p.chromium.launch(headless=True)
page = browser.new_page(viewport={"width": 1365, "height": 768}, device_scale_factor=1)
page.set_cache_enabled(False)
start = perf_counter()
page.goto("https://example.com", wait_until="networkidle", timeout=90_000)
elapsed_ms = (perf_counter() - start) * 1000
timing = page.evaluate("""() => ({
navigation: performance.getEntriesByType('navigation')[0].toJSON(),
paints: performance.getEntriesByType('paint').map(e => e.toJSON())
})""")
print({"elapsed_ms": elapsed_ms, "timing": timing})
browser.close()Playwright and Puppeteer are automation choices; keep the browser engine, version, state, and workload explicit when comparing results.
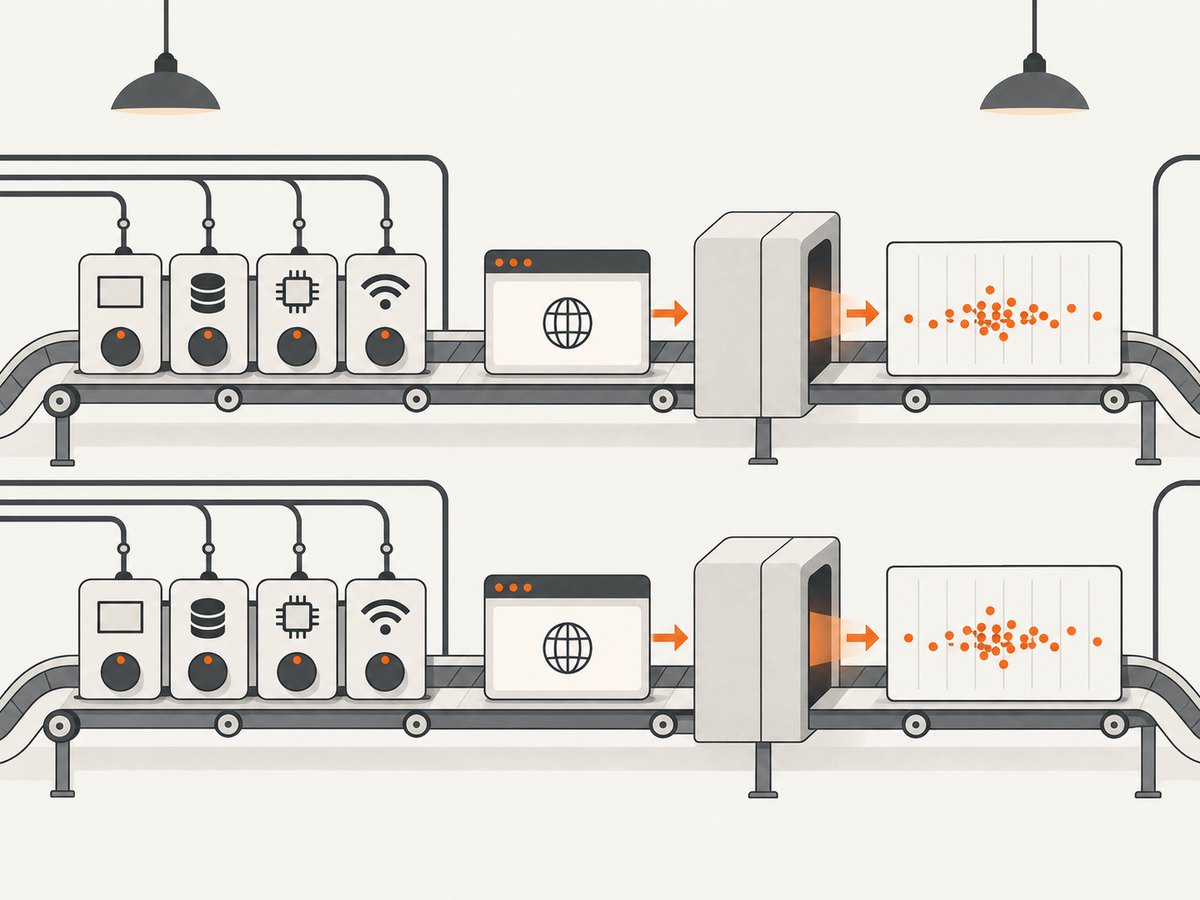
9. Repeat runs and compare distributions
- Warm up the harness and discard setup failures that are unrelated to the page, while recording them.
- Run the same workload repeatedly under unchanged conditions.
- Report median or another chosen central tendency together with spread such as minimum, maximum, percentiles, or interquartile range.
- Keep raw samples, traces, and failure logs so an outlier can be investigated.
- Change one factor at a time from a baseline. Do not update browser version, application code, throttling, and cache policy in one comparison.
There is no universal repetition count in the cited Chrome guidance. Choose enough runs to reveal the noise in your own environment and document that choice. A single fastest run is not evidence of a general improvement.
10. Interpret results without overclaiming
- State the tested browser build, host, mode, viewport, cache state, throttling, URL, and workload.
- Show raw metrics alongside any Lighthouse score.
- Use traces to explain likely causes rather than claiming that correlation proves causation.
- Separate lab measurements from real-user field data.
- Do not generalize Chromium results to Firefox, WebKit, different hardware, or different operating systems without separate evidence.
Chrome’s official wording is concise: Chrome now has unified Headless and headful modes.
The shared browser code does not make your CPU, memory, browser version, network, or page state representative of every user.
11. Troubleshooting
The browser fails to launch in CI
Use a container with compatible system libraries, ensure the browser binary is installed, and inspect the exact launch error. In restricted containers, --no-sandbox is commonly required by the environment; use it only when it matches your CI security model. --disable-dev-shm-usage can avoid a small shared-memory mount causing crashes.
Runs hang at network idle
Long polling, WebSockets, analytics, or advertisements keep connections open. Replace an unbounded idle wait with a meaningful selector and a fixed, recorded settling delay, or instrument an application-ready mark.
Results vary widely
Check CPU contention, memory pressure, background processes, routing, extensions, antivirus, A/B tests, ads, cache state, and authentication. Pin the environment, clear or warm state consistently, and increase repetitions.
Cold and warm results are indistinguishable
Verify that cache, cookies, service workers, and storage are actually reset. A browser context reset may be required; disabling the HTTP cache alone does not remove application state.
The score changes after a tool upgrade
Record Lighthouse, browser, and automation-library versions. Scoring weights and metric implementations change, so compare raw values and rerun the baseline with the new versions.
A trace is too large or missing screenshots
Limit the interaction window, disable screenshots unless visual frames are needed, and select only the trace categories needed for diagnosis. Confirm that tracing stops in a finally block when the test fails.
The page is blocked by a bot check
Record the block as a workload outcome instead of treating it as page performance. Use an authorized test environment or test account; do not claim a successful page measurement when the intended page never loaded.
12. Reliability, performance, and cost considerations
- Reliability: make readiness explicit, bound every timeout, capture console and request failures, and retain artifacts for failed runs.
- Harness overhead: browser startup, compilation, and container cold starts are part of end-to-end latency but not necessarily page latency. Report them separately.
- Parallelism: parallel browsers improve throughput but introduce CPU, memory, disk, and network contention. Calibrate concurrency before using it in comparisons.
- Trace cost: screenshots and broad categories increase trace size and collection overhead. Enable them for diagnosis, not every smoke run.
- Network cost: repeated uncached navigation downloads the page each time. Use a controlled test origin or account for bandwidth and server load.
- Hosted capture: if you only need a deterministic screenshot artifact rather than a full performance trace, a screenshot API can remove browser installation and maintenance from that task.
Or skip the browser setup
ScreenshotNeo provides a website screenshot API and MCP server. A single GET request returns PNG, JPEG, WebP, or PDF. See the ScreenshotNeo API documentation for parameters and response details.
curl -G "https://api.screenshotneo.com/v1/shot" -d access_key=YOUR_API_KEY --data-urlencode url=https://stripe.com -o shot.webpimport requests
r = requests.get("https://api.screenshotneo.com/v1/shot", params={"access_key": "YOUR_API_KEY", "url": "https://stripe.com"}, timeout=90)
open("shot.webp", "wb").write(r.content)const q = new URLSearchParams({ access_key: 'YOUR_API_KEY', url: 'https://stripe.com' });
const res = await fetch(`https://api.screenshotneo.com/v1/shot?${q}`);Before capture, ScreenshotNeo accepts cookie and consent banners and removes more than 60 known consent platforms, newsletter popups, and chat widgets; each step can be turned off. Bot checks or CAPTCHAs, blank pages, timeouts, failed loads, and cache hits cost nothing, and the response identifies the page verdict and billing status with X-Page-Verdict and X-Billed headers. Its MCP server includes take_screenshot, get_page_info, and capture_pdf for Claude, Cursor, and other MCP clients. The Free plan includes 1,000 screenshots per month without a card; paid plans start at $5 for 3,000.
Create a free ScreenshotNeo account to get 1,000 screenshots a month with no card.
FAQ
Is headless Chrome faster than headful Chrome?
It depends on the browser version, mode, host, flags, workload, and measurement method. Measure the exact modes you plan to compare; do not assume a universal speed difference.
Should I use Lighthouse’s score as my benchmark?
Use the score as a summary for the recorded Lighthouse version and conditions. Keep and compare the underlying metric values and traces.
How many runs are enough?
No fixed number applies to every page or host. Run enough repetitions to characterize noise, then report the distribution and your protocol.
Can a headless test predict real-user experience?
It can provide a controlled lab measurement. It cannot by itself represent every user’s device, browser, network, extension set, or page state.
When should I add User Timing?
Add marks when the user-visible operation is not represented by navigation or built-in metrics, such as search results appearing or a dashboard becoming interactive.