How to Use Browser Tools MCP with the Chrome Extension
Connect BrowserTools MCP to Chrome to inspect console logs, network activity, screenshots, and audits from your live browser session.
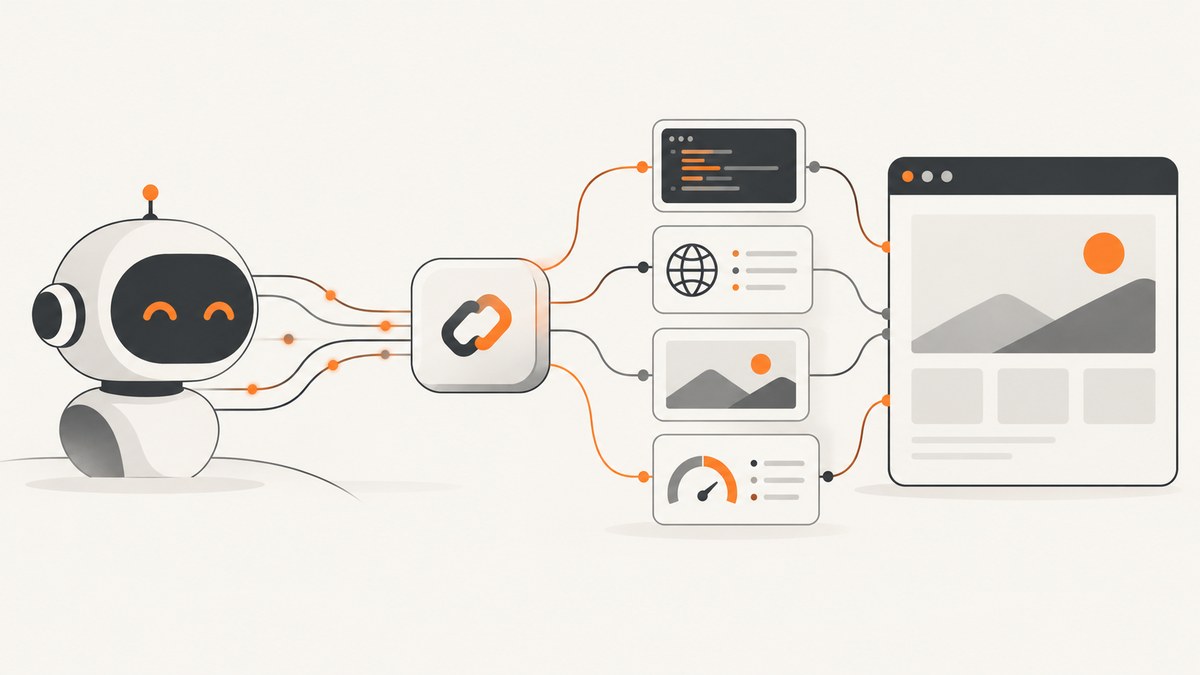
Short answer: BrowserTools MCP needs two pieces: an MCP server started with npm/npx and a Chrome extension loaded as an unpacked extension. Add the server to your MCP client, load the extension from the repository’s chrome-extension folder, open DevTools on the tab you want to inspect, then ask your AI client to read console output, inspect network activity, capture a screenshot, or run an audit.
BrowserTools MCP streams data from the real Chrome session already open on your computer. That makes it useful for debugging logged-in development environments, but it also means the connected tab can expose cookies, account data, and page contents to the AI client. Use a browser profile and tab that contain only data the agent is allowed to access.
What BrowserTools MCP does
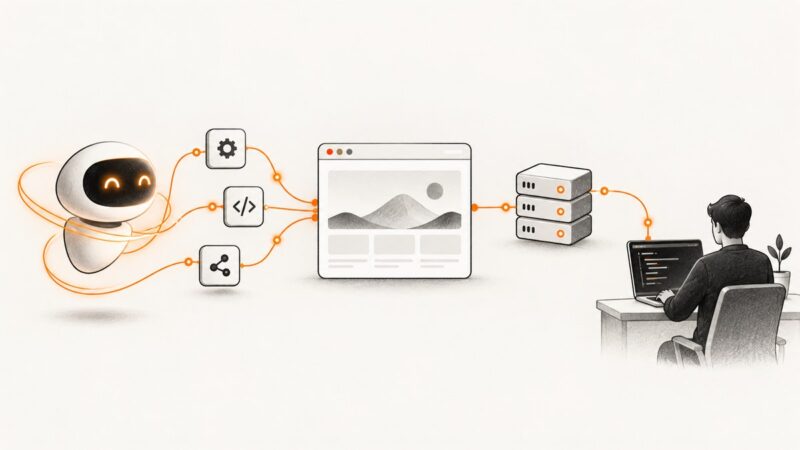
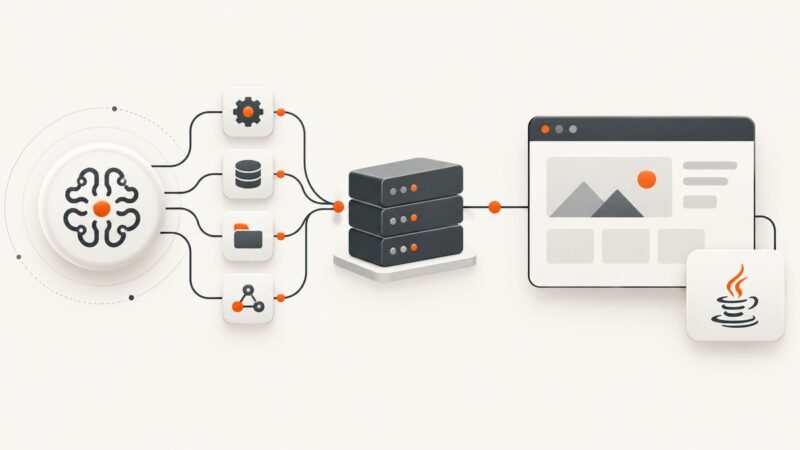
BrowserTools MCP is a bridge between an AI coding client and Chrome. The current AgentDeskAI README describes the architecture as “Two pieces: an MCP server (one command) and a Chrome extension.” The server exposes MCP tools, while the extension observes the inspected Chrome tab and forwards browser data.
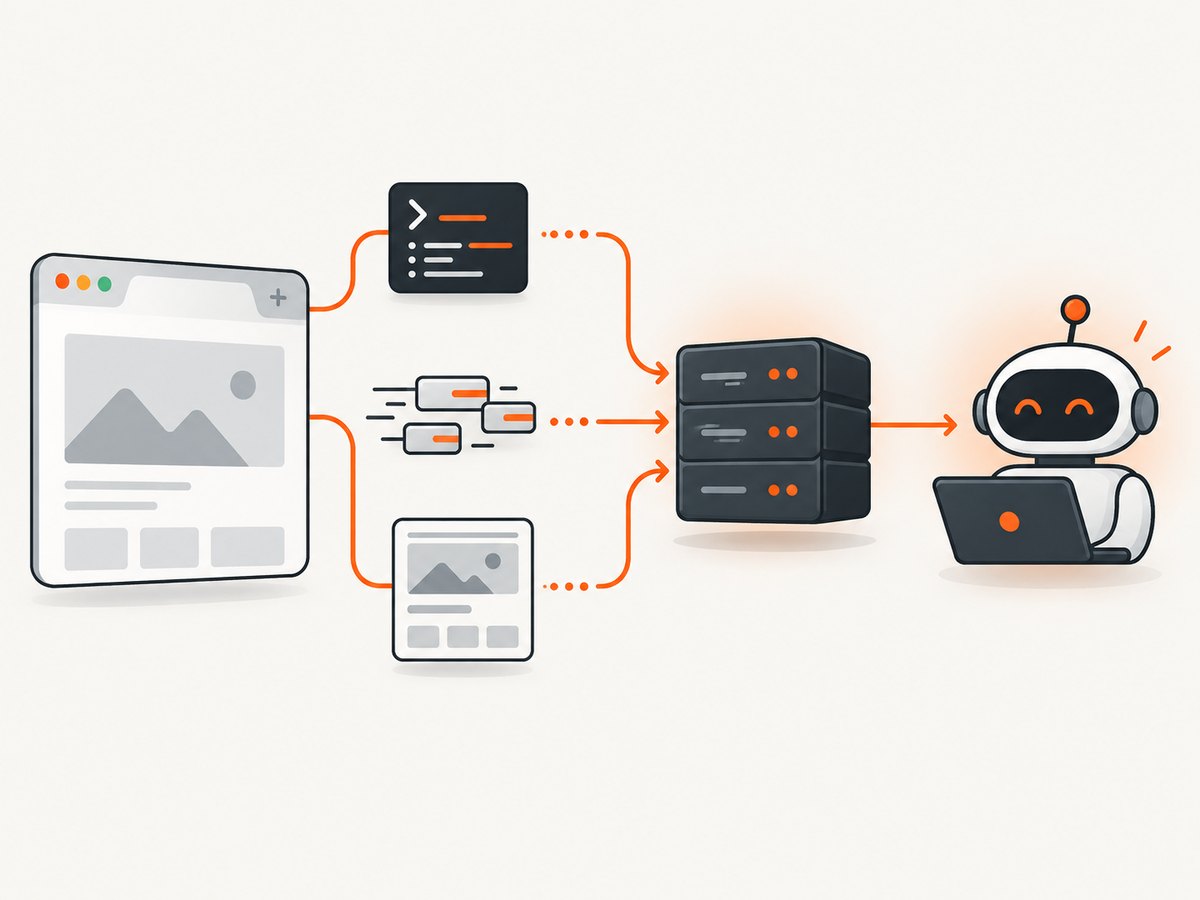
- Read console output and JavaScript errors.
- Monitor network requests and responses.
- Take screenshots of the current page.
- Run Lighthouse-style performance, accessibility, SEO, and best-practice audits.
- Choose a target tab through the project’s tab-listing workflow when several tabs are open.
It is different from a screenshot API: BrowserTools MCP works with a browser session you already have open. A screenshot API is usually better for repeatable, server-side captures, CI jobs, or capturing public URLs without configuring a local browser.
Prerequisites
- Google Chrome or a Chromium-based browser that supports loading unpacked extensions.
- Node.js 22.19 or newer, according to the current README.
- An MCP-compatible client such as Claude, Cursor, or another client that accepts an
mcpServersconfiguration. - The BrowserTools MCP repository downloaded or cloned locally so you can select its
chrome-extensiondirectory.
Check Node before configuring the client:
node --versionIf the version is older than 22.19, upgrade Node first. An old runtime can cause the MCP command to fail before Chrome is involved.
Install and connect BrowserTools MCP
1. Add the MCP server to your client
Add this entry to the MCP configuration used by your coding client:
{
  "mcpServers": {
    "browser-tools": {
      "command": "npx",
      "args": ["-y", "@agentdeskai/browser-tools-mcp@latest"]
    }
  }
}
Restart or reload the MCP client after saving the configuration. The -y flag lets npx install the package without an interactive confirmation.
2. Download the Chrome extension source
Download or clone the BrowserTools MCP repository. You need the repository directory that contains chrome-extension; do not select an arbitrary parent folder.
3. Load the extension in Chrome
- Open
chrome://extensions. - Enable Developer mode.
- Choose Load unpacked.
- Select the repository’s
chrome-extensiondirectory. - Confirm that the extension appears enabled. Pinning it to the toolbar is optional, but useful when checking its status.
4. Open DevTools on the target page
Navigate to the page you want the agent to inspect and open Chrome DevTools with F12 (or the browser’s equivalent shortcut). BrowserTools MCP begins capture when DevTools is open. Use the BrowserTools panel to check settings and connection status.
5. Ask for a concrete task
Start with a narrow request so you can verify the connection:
Inspect the current tab and list all console errors, including their source file and line number.Then try a network or audit request:
Show failed network requests from the current tab and group them by status code.

Run an accessibility and performance audit for the current page and summarize the highest-priority findings.
Verify that the connector is working
Use the diagnostic command when the client cannot see Chrome:
npx @agentdeskai/browser-tools-mcp --doctorFor a more visible startup trace, run with verbose logging:
npx @agentdeskai/browser-tools-mcp --verboseVerbose mode helps distinguish a healthy connector with no browser events from a connector that never connected. Look for extension, console, and network events while DevTools is open on the intended tab.
Common workflows
Read console errors
Open DevTools, reload the page, and ask the client to list errors after the reload. Mention whether you want uncaught exceptions, warnings, or all messages. A reload gives the agent a clean time boundary for the investigation.
Inspect network activity
Ask for failed requests first, then narrow by URL, method, status, or resource type. If an API call is missing, reproduce the action in the page while the agent is watching the tab.
Capture a screenshot
Keep DevTools open and ask for a screenshot of the current tab or a specific state. For a deterministic result, first set the viewport, dismiss transient dialogs, and navigate to the exact state you want captured.
Run an audit
Request a Lighthouse-style audit for performance, accessibility, SEO, or best practices. Treat the result as a diagnostic snapshot of the current tab: extensions, authentication state, cached resources, throttling, and local data can affect the findings.
Why logs or screenshots may be missing
| Symptom | Likely cause | Fix |
|---|---|---|
| The MCP client shows no BrowserTools tools | The client has not reloaded its MCP configuration, or the command cannot start. | Restart the client, run node --version, and run npx @agentdeskai/browser-tools-mcp --doctor. |
| The extension is absent | The wrong directory was selected in Load unpacked. | Reload the repository’s chrome-extension directory specifically. |
| Connection appears idle | DevTools is closed, or it is open on another tab. | Open DevTools on the intended tab, reload that page, and retry with --verbose. |
| Console output is empty | No messages were emitted after the connector started, or the wrong tab is targeted. | Reload the page, trigger the failing action, and use the tab-listing workflow to select the correct tab. |
| Network requests are missing | The action was not reproduced while capture was active. | Start verbose logging, perform the action again, and ask for failed requests by status code. |
Windows reports that npx cannot be found |
The MCP client is not resolving the Windows command shim. | Configure the command as cmd with arguments /c npx -y @agentdeskai/browser-tools-mcp@latest. |
| Audits differ between runs | Page state, cache, network conditions, or authentication changed. | Use the same tab state and repeat the audit under the same conditions before comparing results. |
Security and maintenance considerations
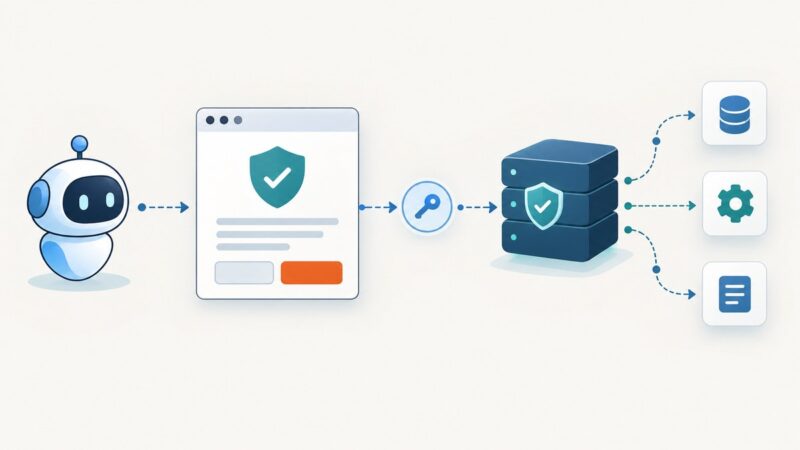
Because the extension observes your real Chrome session, an agent may be able to read authenticated pages, cookies exposed through browser APIs, form contents, and other sensitive data in the connected tab. Use a separate Chrome profile for agent work, close unrelated tabs, and never connect a session that contains data outside the task’s authorization.
Do not expose a remote debugging port to the network while viewing sensitive sites. Keep Chrome and the MCP client on the same trusted machine unless you have a specific, reviewed security design.
Maintenance signals require care. The current README documents the one-command MCP connector described here, while an older AgentDeskAI repository page carries a notice that the project is no longer active. Check the repository and npm package immediately before installation and verify that the command and extension version still match. The instructions in this article were checked against the available research on 30 September 2026.
BrowserTools MCP vs Chrome DevTools MCP
| Question | BrowserTools MCP | Chrome DevTools MCP |
|---|---|---|
| Session model | Designed around the Chrome session already open on your machine, with an unpacked extension. | Official Chrome tooling for controlling and inspecting a live browser. |
| Connection options | Start the MCP server with the npm/npx command and connect the extension. | Documents automatic connection with --autoConnect, manual connection with --browser-url, WebSocket endpoints, headless mode, channel selection, and isolated profiles. |
| Best fit | Quick inspection of the browser session you are actively using. | Workflows that need documented connection modes, isolated profiles, or headless operation. |
| Security concern | The connected tab can expose the real session’s authenticated data. | Chrome also warns that attaching to an existing session gives the agent access to logged-in accounts, cookies, and browser data. |
Choose based on the session model you need. BrowserTools MCP is convenient when the page is already open and you want an AI client to inspect it. Chrome DevTools MCP is a stronger fit when you need explicit browser connection and profile controls.
Performance, reliability, and cost
- Performance: BrowserTools MCP observes a live tab, so the page’s own load time and the amount of console or network traffic dominate the experience. Keep requests focused instead of asking the agent to summarize an unbounded session.
- Reliability: Reopen DevTools after switching tabs, reload before reproducing a bug, and use verbose mode when a silent connector is ambiguous. Pin the extension and keep the MCP package command current.
- Cost: The software is installed locally through npm/npx. The research dossier publishes no authoritative usage, speed, accuracy, or pricing statistics for BrowserTools MCP, so do not infer them.
Or skip the browser setup
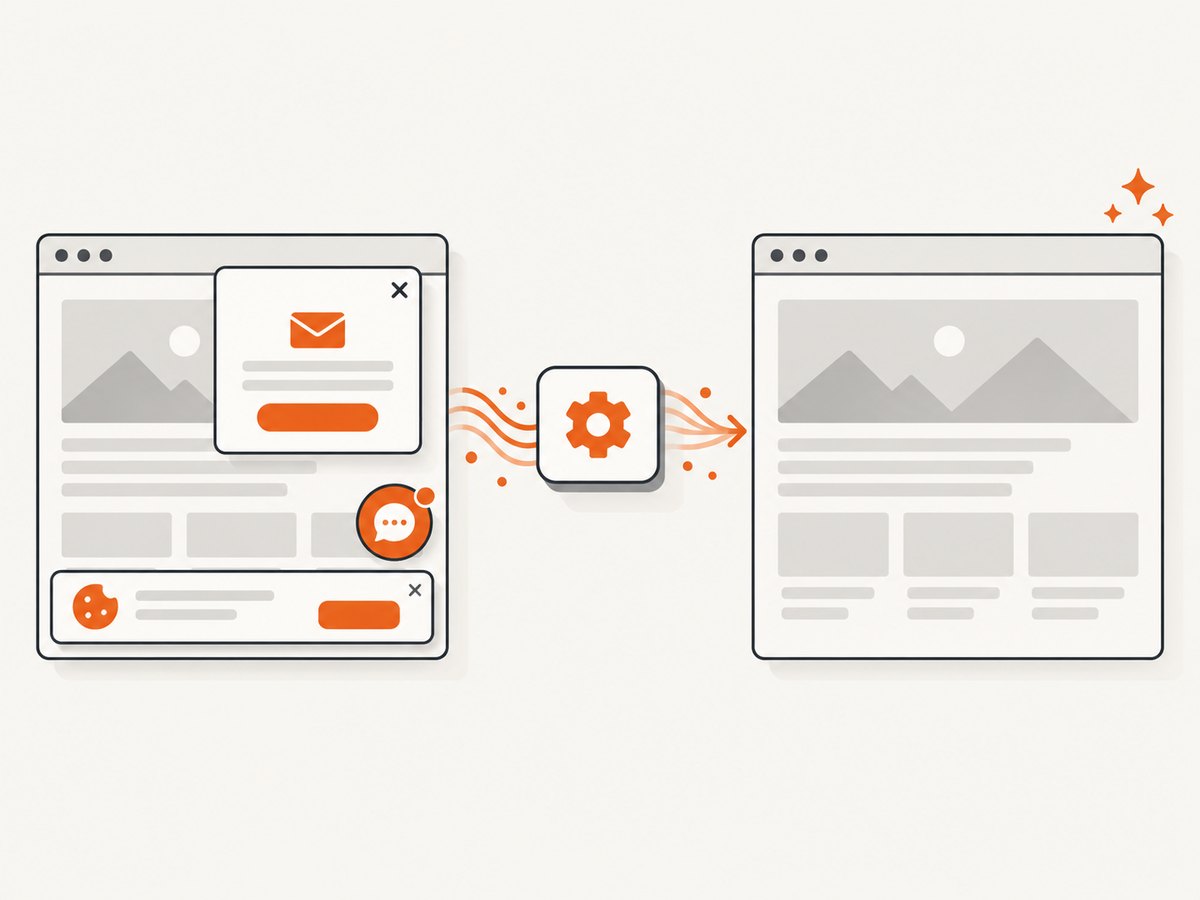
If your goal is a repeatable screenshot or PDF rather than inspection of a live debugging session, ScreenshotNeo provides a single HTTP request. Its API accepts a URL and returns PNG, JPEG, WebP, or PDF. Cookie and consent banners are accepted and 60+ known consent platforms, newsletter popups, and chat widgets are removed before capture; each step can be turned off. Bot checks, blank pages, failed loads, timeouts, and cache hits are not billed, and the response identifies the result with X-Page-Verdict and X-Billed headers. ScreenshotNeo also includes an MCP server with take_screenshot, get_page_info, and capture_pdf tools for AI clients.
See the ScreenshotNeo API documentation for the complete option list.
curl -G "https://api.screenshotneo.com/v1/shot" -d access_key=YOUR_API_KEY --data-urlencode url=https://stripe.com -o shot.webpimport requests
r = requests.get("https://api.screenshotneo.com/v1/shot", params={"access_key": "YOUR_API_KEY", "url": "https://stripe.com"}, timeout=90)
open("shot.webp", "wb").write(r.content)const q = new URLSearchParams({ access_key: 'YOUR_API_KEY', url: 'https://stripe.com' });
const res = await fetch(`https://api.screenshotneo.com/v1/shot?${q}`);Relevant options include full-page capture with lazy images loaded, CSS-selector element capture, dark mode, device presets or custom viewports, retina scale, PDF paper and margin settings, custom CSS and JavaScript, clicks, selector or network-idle waits, request blocking, headers, cookies, user agents, authorization, timezone, geolocation, transparent backgrounds, resizing, selectable cache TTLs, signed links, asynchronous jobs with signed webhooks, bulk capture for 100 URLs per call, and a usage API.
There is a free plan with 1,000 screenshots per month and no card. Paid plans start at $5 for 3,000 screenshots; every feature is available on every plan. Create a free ScreenshotNeo account to get started.
FAQ
Does BrowserTools MCP replace Chrome DevTools?
No. It gives an AI client a bridge into DevTools and the inspected tab; Chrome DevTools remains the browser’s inspection interface.
Do I need a second server process?
The current README documents the MCP server and extension as the two required pieces. It does not require the older three-process setup described by legacy instructions.
Why must DevTools be open?
Capture begins when DevTools is open on the page being inspected. Opening DevTools on another tab does not target the page you want.
Can I use it on authenticated pages?
Yes, when the connected Chrome session is already authenticated, but that also increases the security impact. Use a restricted profile and tab.
When should I use an API instead?
Use an API when you need server-side automation, CI captures, bulk URLs, PDFs, or a clean result without managing a local browser and extension.