Chrome DevTools MCP Server: Complete Setup and Usage Guide
Set up Chrome DevTools MCP in Codex, connect Chrome sessions safely, use browser debugging tools, and understand configuration, limits, and fixes.
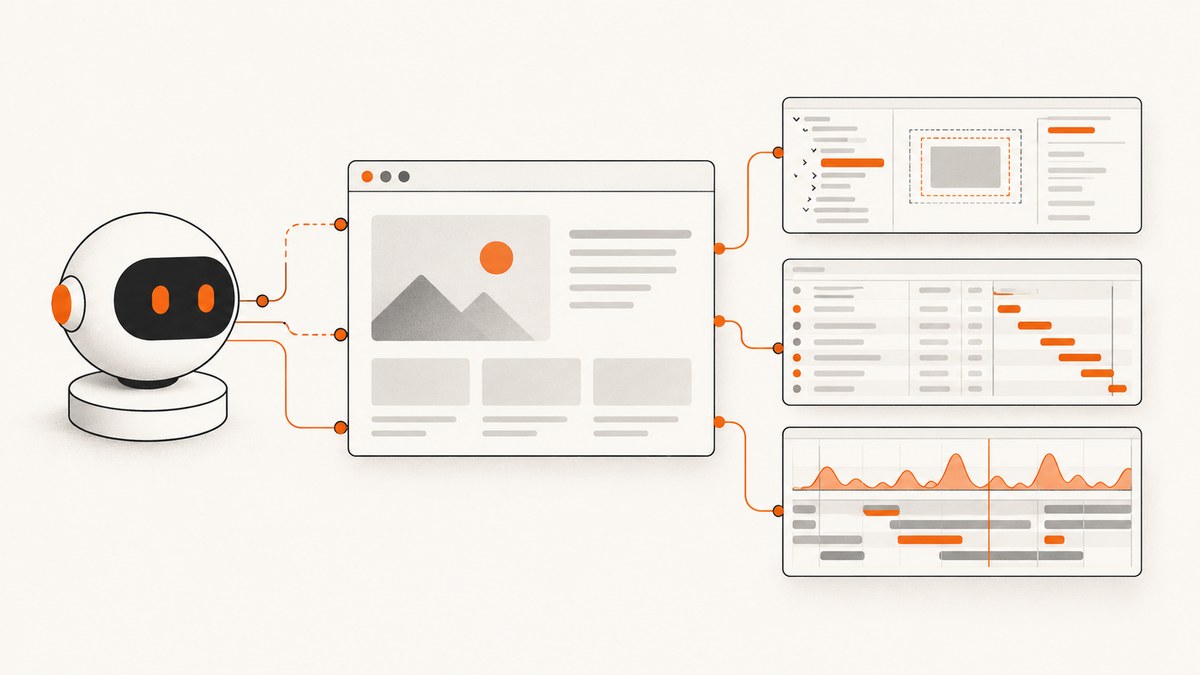
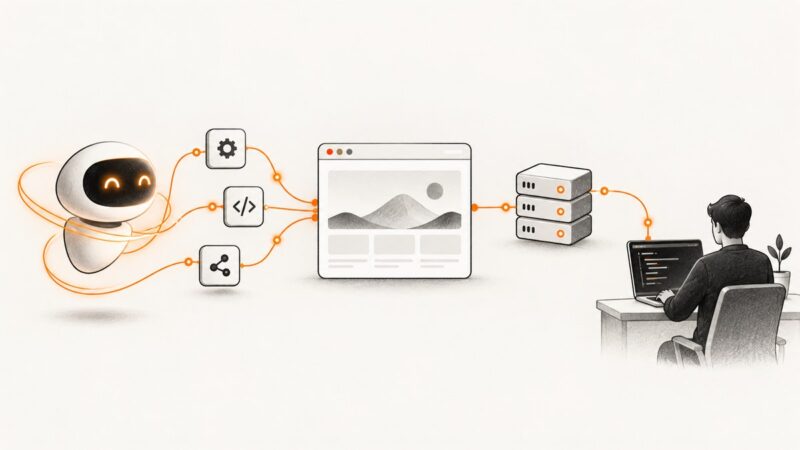
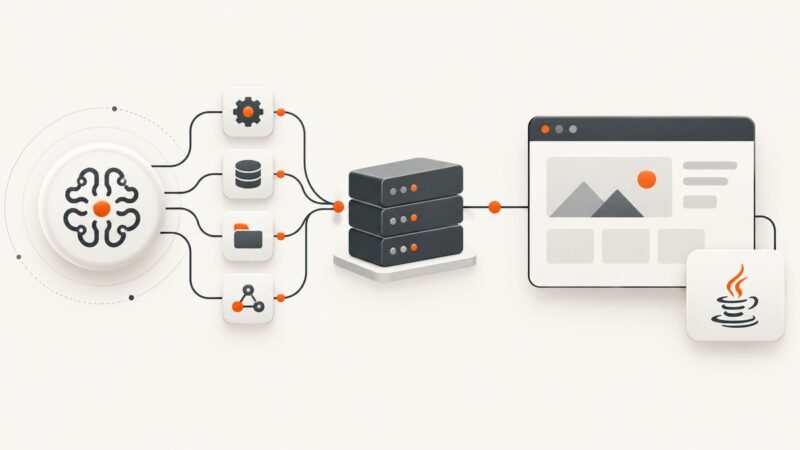
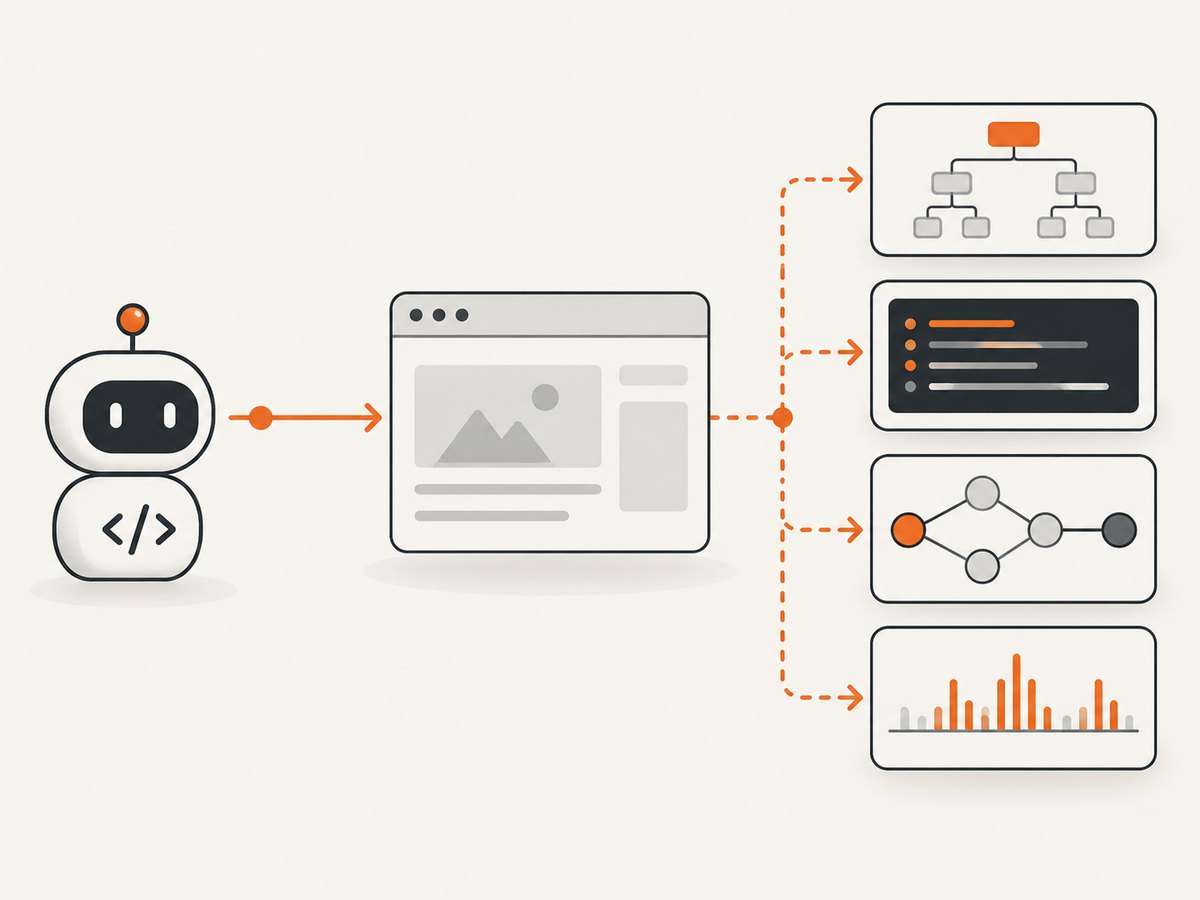
Chrome DevTools MCP Server lets a compatible AI coding agent control and inspect a live Chrome browser through the Model Context Protocol (MCP). In Codex, install it with codex mcp add chrome-devtools -- npx chrome-devtools-mcp@latest. The server can interact with pages, inspect DevTools data, debug web applications and gather performance information.
Chrome describes DevTools for agents as “a suite of tools that brings the power of Chrome DevTools to your AI coding workflows.” See the official getting-started guide and the ChromeDevTools MCP repository for version-sensitive details.
What Chrome DevTools MCP does
The server exposes a live Chrome instance to an MCP-compatible client. Depending on the enabled tool set, an agent can:
- Open pages and interact with browser content.
- Inspect the DOM, console output, network activity and page state.
- Investigate JavaScript and layout problems with DevTools data.
- Collect performance information while a page is running.
- Use a visible browser, a headless browser, or an existing Chrome session.
Connecting the MCP server does not necessarily launch Chrome immediately. The browser normally starts when the agent first calls a browser-dependent tool.
Requirements
- Node.js LTS and npm.
- Current stable Chrome or a newer supported version.
- An MCP client such as Codex or another compatible coding agent.
- Permission to start Chrome or connect to the selected browser session.
Check the repository and Chrome documentation before publishing a pinned setup because package versions, Chrome compatibility and command-line flags change over time.
Install Chrome DevTools MCP in Codex
1. Add the server
codex mcp add chrome-devtools -- npx chrome-devtools-mcp@latestThe @latest tag follows the latest published server release. That is convenient for a new setup but means behavior can change when the package updates.
2. Confirm the MCP entry
Restart or reload Codex if it does not discover the new server immediately. Ask the agent to list available MCP tools, then invoke a browser-dependent tool. Chrome should start at that point unless you configured an existing-session connection.
3. Try a first task
Use a specific instruction such as: “Open my local application, inspect the console for errors, and report the failing source file and stack trace.” The agent should start Chrome, navigate to the page and use the available DevTools tools.
Generic MCP configuration
Clients that accept a JSON MCP configuration can run the package through npx:
{
  "mcpServers": {
    "chrome-devtools": {
      "command": "npx",
      "args": ["-y", "chrome-devtools-mcp@latest"]
    }
  }
}
The -y flag allows npx to install the package without an interactive prompt. Follow your client’s configuration format; the key names around this command differ between MCP clients.
Choose how Chrome runs
Managed visible Chrome
This is the simplest mode for development. The server starts a browser that you can watch. It is useful when an agent needs to interact with a page and you want to see each navigation or click.
Headless Chrome
The configuration guide documents headless operation and Chrome channel selection. Headless mode is useful on CI or a remote machine where no desktop is available. Use the exact flags supported by the version you installed, because command-line options are version-sensitive.
Connect to an existing session automatically
The project documents --autoConnect for connecting to an existing Chrome session. The guide states that this workflow requires Chrome 144 or newer. Existing-session access can include the signed-in accounts, cookies and other browser data already available in that profile.
Connect through a browser debugging URL
You can also provide --browser-url and connect to a Chrome instance exposing its debugging endpoint. This is useful when Chrome runs separately from the MCP process, including on another development host.
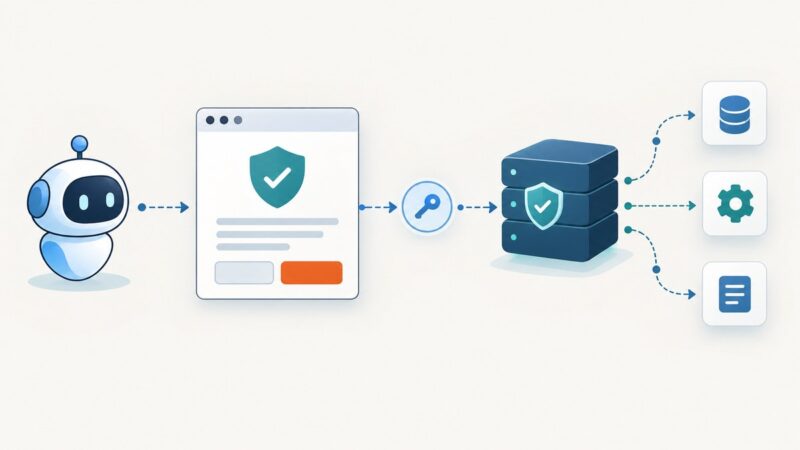
A debugging endpoint is a control surface: any application that can reach the port may be able to control the browser. Restrict network access and avoid exposing it publicly.
Full versus slim tool configuration
The project documents a slim configuration for simpler browser tasks. Enable only the tool categories your workflow needs when reducing agent context or limiting available actions. Consult the current configuration guide for the supported category names.
Can Chrome DevTools MCP use my existing Chrome session?
Yes. Use the documented automatic connection mode or connect manually with a browser debugging URL. This allows the agent to work with an already open profile, but it also gives the agent access to that profile’s authenticated state.
- Close sensitive tabs or use a dedicated Chrome profile.
- Start Chrome with the connection method documented for your installed version.
- Configure the MCP server with
--autoConnector--browser-url. - Run a harmless inspection first and confirm which tab and profile are exposed.
- Stop Chrome or remove the debugging endpoint when finished.
Use an existing authenticated session only with an agent you trust.
Typical development workflows
Debug a failing page
- Ask the agent to open the route that fails.
- Request console errors and stack traces.
- Ask it to inspect the failing network request, including status and response timing.
- Have it correlate the browser evidence with the source code.
- Reload and verify the fix in the live page.
Investigate layout problems
Ask the agent to inspect the affected element, computed styles, box dimensions and nearby layout containers. Include the viewport size in the request so the result is reproducible.
Collect performance evidence
Use the performance-oriented tools to inspect a real page load, then ask the agent to identify the largest contributors and the next diagnostic step. The documentation describes capabilities, not a guaranteed speed improvement or benchmark, so treat the output as evidence for investigation rather than a universal score.
Chrome DevTools MCP versus a screenshot API
Chrome DevTools MCP controls a live browser and is suited to debugging and inspection. A screenshot API is better when your application needs a repeatable image or PDF from a URL without maintaining browser automation infrastructure.
| Need | Best fit |
|---|---|
| Inspect console, DOM, network or performance data | Chrome DevTools MCP |
| Interact with an authenticated, already open browser | Chrome DevTools MCP |
| Generate a clean PNG, JPEG, WebP or PDF from a URL | ScreenshotNeo |
| Capture many URLs from a backend job | ScreenshotNeo bulk or async capture |
Or skip the browser setup
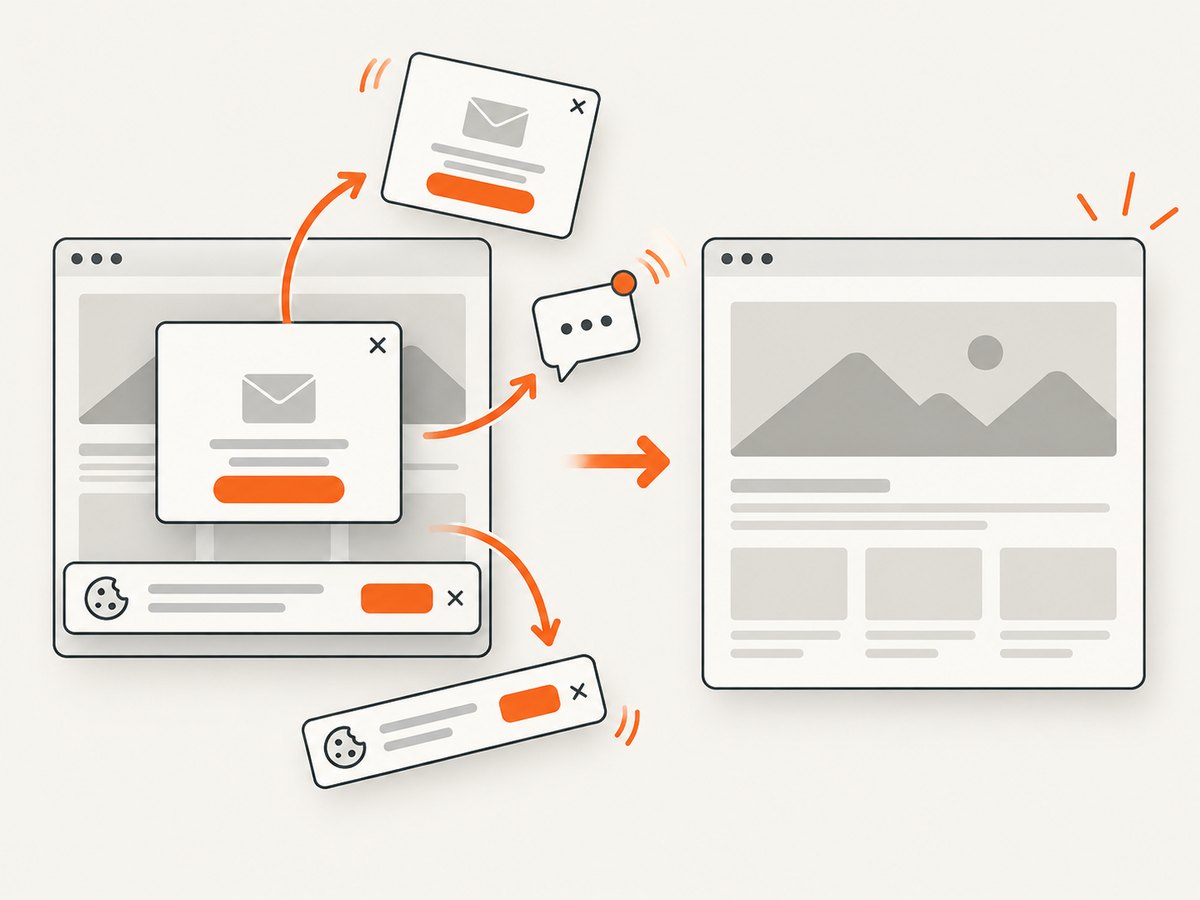
If your goal is a rendered image or PDF rather than interactive debugging, ScreenshotNeo provides a single GET request. It removes cookie and consent banners, newsletter popups and chat widgets before capture; bot checks, blank pages, timeouts, failed loads and cache hits are not billed, and the response reports the result in X-Page-Verdict and X-Billed headers. It also provides an MCP server with take_screenshot, get_page_info and capture_pdf tools for AI agents.
See the ScreenshotNeo API documentation for all options.
curl -G "https://api.screenshotneo.com/v1/shot" -d access_key=YOUR_API_KEY --data-urlencode url=https://stripe.com -o shot.webpimport requests
r = requests.get("https://api.screenshotneo.com/v1/shot", params={"access_key": "YOUR_API_KEY", "url": "https://stripe.com"}, timeout=90)
open("shot.webp", "wb").write(r.content)const q = new URLSearchParams({ access_key: 'YOUR_API_KEY', url: 'https://stripe.com' });
const res = await fetch(`https://api.screenshotneo.com/v1/shot?${q}`);Every plan includes the capture features: full-page shots with lazy images loaded, CSS-selector element capture, dark mode, device presets, custom viewport and retina scale, PDF controls, custom CSS and JavaScript, clicks, waits, blocking rules, headers, cookies, user agents, authorization, timezone, geolocation, transparent backgrounds, resizing, selectable cache TTLs, signed links, async webhooks, bulk capture and a usage API. The free plan includes 1,000 shots each month with no card; paid plans start at $5 for 3,000 shots. Create a free ScreenshotNeo account.
Troubleshooting
Codex cannot find the server
Cause: The MCP entry was not loaded or npx is unavailable. Fix: Confirm Node.js and npm are installed, rerun the Codex command exactly, then restart or reload the client.
Chrome does not open
Cause: Chrome starts lazily, so no browser appears until a browser tool is called; headless mode may also be enabled. Fix: Invoke a browser-dependent tool and check the configured headless and channel flags.
Automatic connection fails
Cause: The installed Chrome version may not meet the documented requirement, or the session is not discoverable. Fix: Check the current guide, update Chrome when appropriate, or use the manual browser debugging URL.
The agent sees the wrong account or tab
Cause: Existing-session mode exposes the selected Chrome profile. Fix: Use a dedicated profile, close unrelated tabs and verify the target page before granting further instructions.
Manual connection is refused
Cause: Chrome is not listening on the supplied debugging URL, the port is blocked, or the URL points to a different host. Fix: Start Chrome with the documented remote-debugging configuration, test reachability from the MCP process and protect the port with network controls.
A tool is missing
Cause: A slim configuration or tool-category filter is active. Fix: inspect the current server configuration and enable the category required for the task.
Performance, reliability and cost notes
- Startup: The first browser-dependent call may include Chrome startup time. Reusing a controlled session can avoid repeated launches.
- Reproducibility: Record Chrome, Node.js and package versions when diagnosing differences between machines.
- Authentication: Existing-session convenience increases the amount of browser state exposed to the agent.
- Remote debugging: Treat the debugging port as privileged access and keep it off public networks.
- Version drift:
@latestand version-sensitive flags are convenient but can change behavior; pin and review versions for CI. - Cost: Chrome DevTools MCP is npm software; the cited documentation does not establish a usage price or performance benchmark. ScreenshotNeo bills only clean captures and provides a free monthly tier.
FAQ
Does MCP replace Chrome DevTools?
No. It gives an AI coding agent access to browser and DevTools workflows so the agent can inspect and debug a live page.
Will connecting MCP automatically share my cookies?
Only when you connect it to an existing profile or session. A newly managed browser does not automatically represent your everyday signed-in profile.
Can I run it in CI?
Yes, the documented headless mode is intended for environments without a visible desktop. Pin versions and configure Chrome explicitly for repeatable jobs.
Is there an official benchmark?
The official sources describe capabilities and setup, but do not provide a topic-specific independent benchmark or guaranteed performance improvement.
Which tool should generate website screenshots for an application?
Use Chrome DevTools MCP when the agent must inspect or interact with a live browser. Use ScreenshotNeo when your application needs a direct screenshot or PDF endpoint with capture controls and predictable billing.