How to Get Chrome DevTools Network Timing Data With Puppeteer
Capture DNS, TLS, TTFB, download, and total request timings in Puppeteer with CDP, requestId correlation, and robust failure handling.
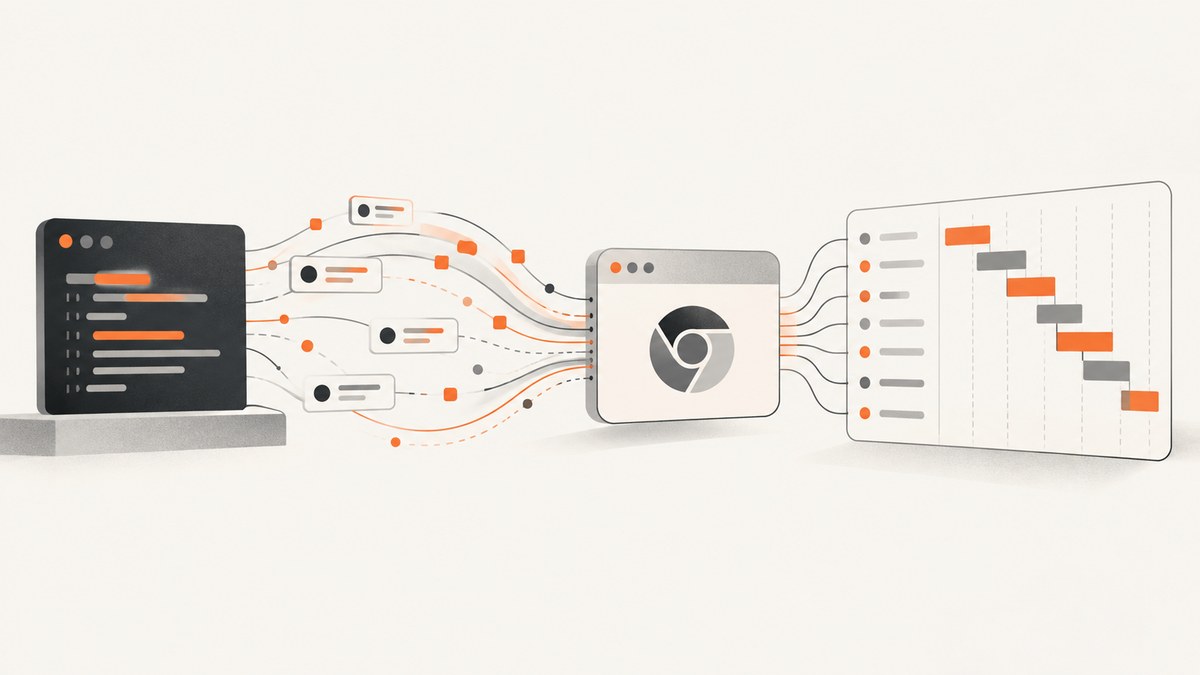
To collect the same request timing data that Chrome DevTools exposes, attach a Chrome DevTools Protocol (CDP) session to your Puppeteer page, enable the Network domain before navigation, and join lifecycle events by requestId. Save Network.requestWillBeSent as the start, copy response.timing from Network.responseReceived, and close each record on Network.loadingFinished (or Network.loadingFailed). The result is machine-readable DNS, connection, TLS, request, TTFB, download, and total elapsed data for every observed request.
This is the supported Puppeteer escape hatch for Network telemetry: Page.createCDPSession() creates the session and CDPSession.send() issues protocol commands. The underlying event and timing definitions are in the Chrome DevTools Protocol Network domain.
1. What you are collecting
DevTools presents a request table, waterfall, and Timing tab. CDP gives you the raw events behind those views. A request normally progresses through:
- requestWillBeSent: URL, method, resource type, frame, timestamp, and redirect information.
- responseReceived: status, MIME type, protocol response details, and (when available) a
ResourceTimingobject. - loadingFinished: completion timestamp and encoded byte count.
- loadingFailed: an error such as DNS failure, blocked request, aborted navigation, or connection reset.
response.timing.requestTime is a seconds baseline. Other timing values are millisecond offsets from that baseline. Useful phases include proxyStart/proxyEnd, dnsStart/dnsEnd, connectStart/connectEnd, sslStart/sslEnd, sendStart/sendEnd, and receiveHeadersStart/receiveHeadersEnd. A duration is the end value minus the start value. Keep absent or negative values as-is: cache hits, connection reuse, service workers, proxies, and protocol behavior can make a phase unavailable.
| DevTools concept | CDP source | How to calculate |
|---|---|---|
| Request start | requestWillBeSent.timestamp |
Use as the lifecycle baseline. |
| DNS | response.timing.dnsStart/dnsEnd |
dnsEnd - dnsStart ms. |
| TCP connect | connectStart/connectEnd |
connectEnd - connectStart ms. |
| TLS | sslStart/sslEnd |
sslEnd - sslStart ms. |
| TTFB | receiveHeadersStart |
Offset from requestTime; DevTools labels waiting for the response. |
| Content download | Lifecycle timestamps | loadingFinished.timestamp - responseReceived.timestamp, when both exist. |
| Total elapsed | Start and finish events | (finishedAt - startedAt) * 1000. |
DevTools groups these values for people; your report should retain the raw offsets and timestamps so later analysis does not lose information.
2. A complete Puppeteer collector
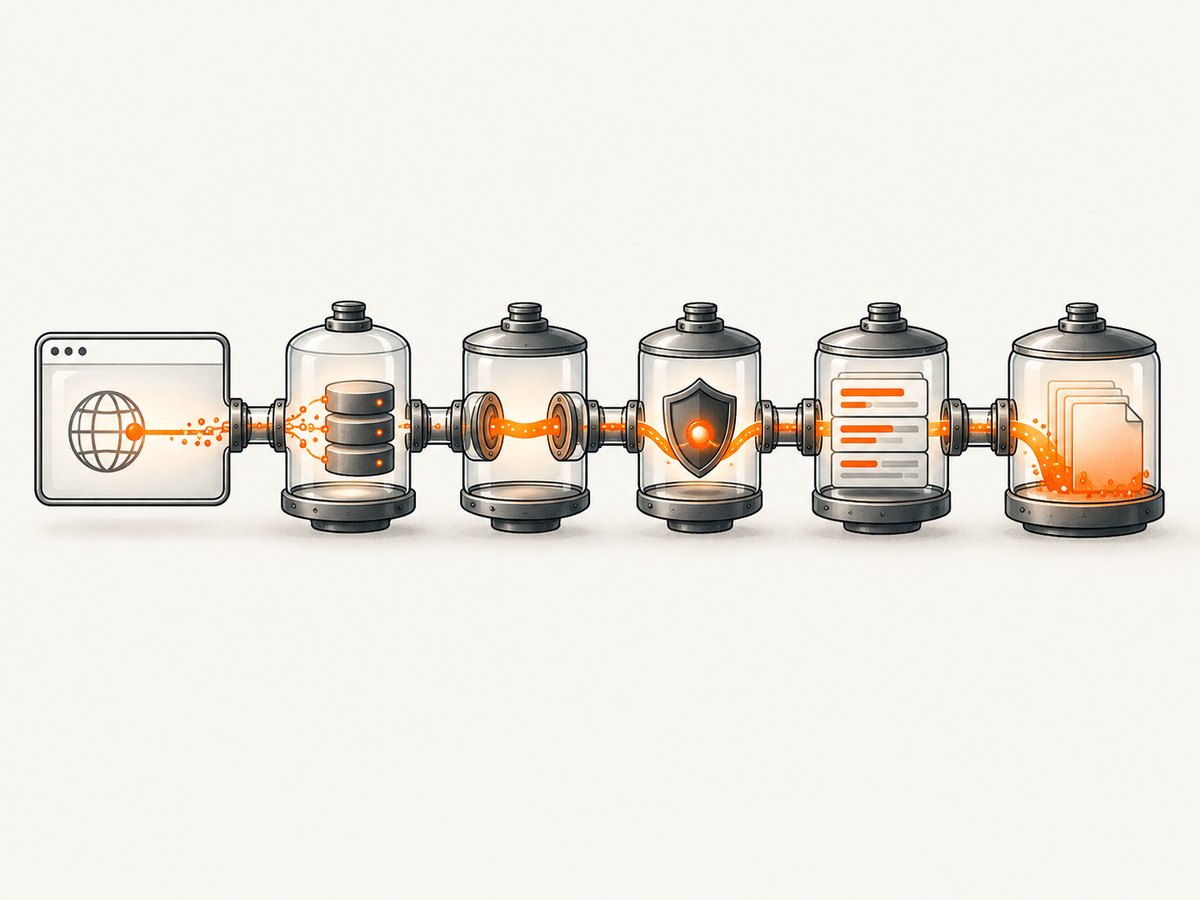
Install Puppeteer with npm install puppeteer. The following ES module records successful and failed requests, redirects, timing phases, frames, resource types, and byte counts. Save it as network-timing.mjs and run node network-timing.mjs https://example.com.
import puppeteer from 'puppeteer';

const target = process.argv[2] || 'https://example.com';
const browser = await puppeteer.launch({
  headless: true,
  args: ['--no-sandbox']
});
const page = await browser.newPage();
const cdp = await page.createCDPSession();
await cdp.send('Network.enable'); // Enable before any navigation.

const requests = new Map();
const completed = [];

function phase(timing, start, end) {
  if (!timing || typeof timing[start] !== 'number' || typeof timing[end] !== 'number') return null;
  return timing[end] - timing[start];
}

function snapshot(record) {
  const t = record.timing;
  return {
    requestId: record.requestId,
    url: record.url,
    method: record.method,
    type: record.type,
    frameId: record.frameId,
    status: record.status ?? null,
    mimeType: record.mimeType ?? null,
    protocol: record.protocol ?? null,
    redirect: Boolean(record.redirectResponse),
    failed: Boolean(record.failed),
    errorText: record.errorText ?? null,
    totalMs: record.totalMs ?? null,
    encodedDataLength: record.encodedDataLength ?? null,
    timing: t ? {
      requestTime: t.requestTime,
      proxyMs: phase(t, 'proxyStart', 'proxyEnd'),
      dnsMs: phase(t, 'dnsStart', 'dnsEnd'),
      connectMs: phase(t, 'connectStart', 'connectEnd'),
      tlsMs: phase(t, 'sslStart', 'sslEnd'),
      sendMs: phase(t, 'sendStart', 'sendEnd'),
      waitingMs: phase(t, 'sendEnd', 'receiveHeadersStart'),
      receiveHeadersMs: phase(t, 'receiveHeadersStart', 'receiveHeadersEnd')
    } : null
  };
}

cdp.on('Network.requestWillBeSent', event => {
  // A redirect completes the previous leg under the same requestId.
  if (event.redirectResponse) {
    const previous = requests.get(event.requestId);
    if (previous) {
      previous.status = event.redirectResponse.status;
      previous.mimeType = event.redirectResponse.mimeType;
      previous.timing = event.redirectResponse.timing ?? null;
      previous.redirectResponse = true;
      previous.finishedAt = event.timestamp;
      previous.totalMs = (event.timestamp - previous.startedAt) * 1000;
      completed.push(snapshot(previous));
    }
  }
  requests.set(event.requestId, {
    requestId: event.requestId,
    url: event.request.url,
    method: event.request.method,
    type: event.type,
    frameId: event.frameId ?? null,
    startedAt: event.timestamp,
    redirectResponse: event.redirectResponse ?? null
  });
});

cdp.on('Network.responseReceived', event => {
  const record = requests.get(event.requestId);
  if (!record) return;
  record.status = event.response.status;
  record.mimeType = event.response.mimeType;
  record.protocol = event.response.protocol ?? null;
  record.timing = event.response.timing ?? null;
  record.responseAt = event.timestamp;
});

cdp.on('Network.loadingFinished', event => {
  const record = requests.get(event.requestId);
  if (!record) return;
  record.finishedAt = event.timestamp;
  record.totalMs = (event.timestamp - record.startedAt) * 1000;
  record.encodedDataLength = event.encodedDataLength;
  completed.push(snapshot(record));
  requests.delete(event.requestId);
});

cdp.on('Network.loadingFailed', event => {
  const record = requests.get(event.requestId);
  if (!record) return;
  record.failed = true;
  record.errorText = event.errorText;
  record.canceled = event.canceled ?? false;
  record.finishedAt = event.timestamp;
  record.totalMs = (event.timestamp - record.startedAt) * 1000;
  completed.push(snapshot(record));
  requests.delete(event.requestId);
});

try {
  await page.goto(target, {waitUntil: 'networkidle0', timeout: 90_000});
} catch (error) {
  console.error(`Navigation failed: ${error.message}`);
}
// Give late protocol events a turn to arrive, then report unfinished requests.
await new Promise(resolve => setTimeout(resolve, 250));
for (const record of requests.values()) completed.push(snapshot(record));
console.log(JSON.stringify(completed, null, 2));
await browser.close();
The --no-sandbox flag is common in restricted containers; omit it when your deployment already provides a browser sandbox. The collector intentionally catches navigation errors so failed subresources still appear in the JSON output.
3. Joining events correctly
Use requestId as the join key
Never join by URL. The same URL can be requested multiple times, and a page can have concurrent requests. requestId is the protocol key across request, response, completion, and failure events. Keep a map until a terminal event arrives.
Handle redirects as separate waterfall legs
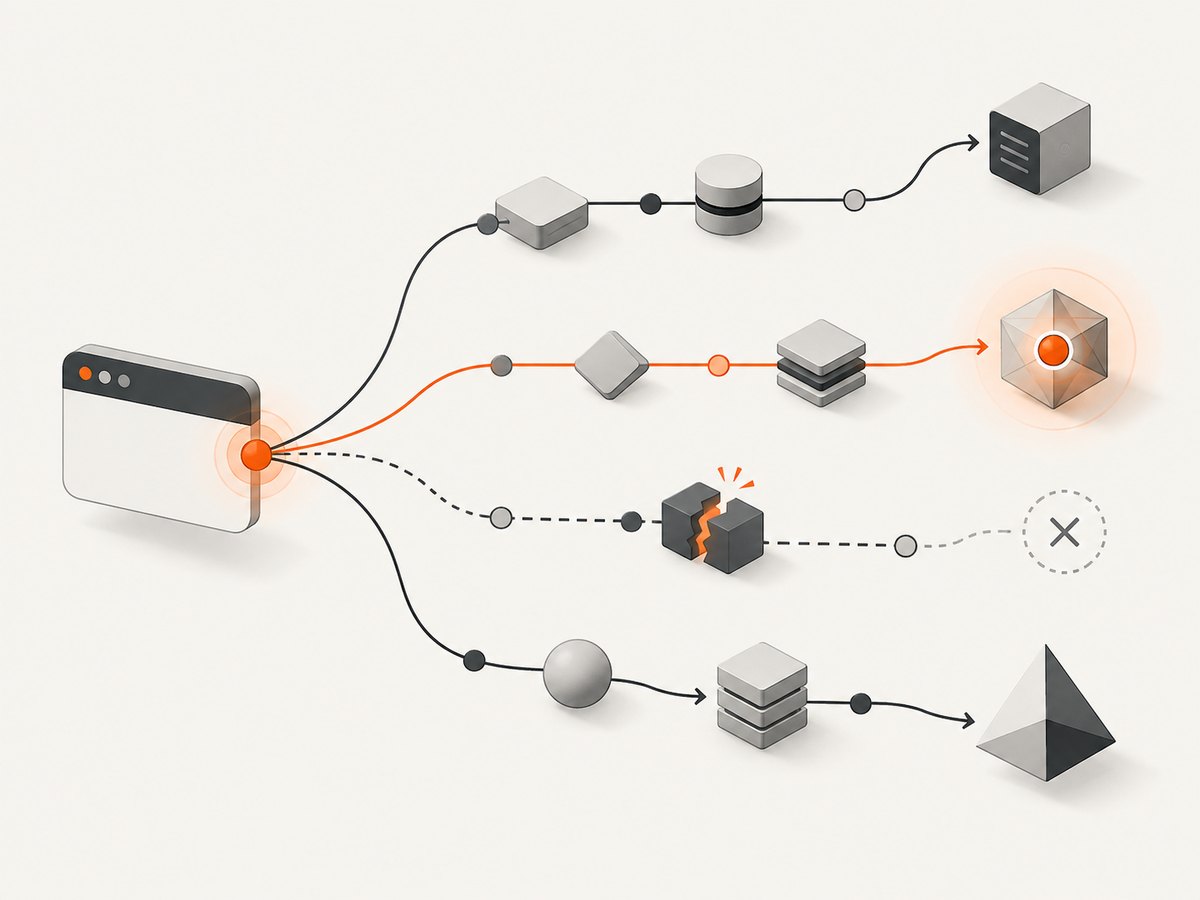
A redirect emits a prior response and a new request. The example closes the prior leg when the next requestWillBeSent carries redirectResponse. Report each leg when diagnosing redirect latency; collapsing them hides DNS, TLS, or server time on intermediate hosts.
Preserve missing timing data
response.timing is optional. A cached response, service-worker response, reused connection, or unusual protocol can omit phases or expose negative offsets. Serialize null and the raw object rather than converting values to zero. Zero means a measured phase with no duration; null means it was not available.
Extra-info events are optional
Network.requestWillBeSentExtraInfo and responseReceivedExtraInfo are not emitted for every request and can arrive before or after their main event. If you collect cookies, security details, or headers from them, merge by requestId without assuming order.
4. Filtering and reporting
Pages can generate hundreds of records. Filter after collection so you retain an audit trail. Common filters are:
- Resource type: keep
Document,Script,Stylesheet,Image,Font,XHR, andFetchfor page-load analysis; inspectWebSocketseparately. - Frame: compare the main frame with third-party iframes using
frameId. - URL: group by origin to find third-party hosts, CDN misses, or API endpoints.
- Status: distinguish transport failure from HTTP errors. A 404 or 503 has a completed HTTP response; it is not a
loadingFailedevent. - Cache and service workers: run controlled warm and cold passes, and record whether a response came from cache or a worker when that metadata is available.
For a waterfall, sort by startedAt and use totalMs as the bar length. For bottleneck reports, rank by total time, then inspect DNS, connect, TLS, waiting, and download phase columns. Store browser and Puppeteer versions with each run because CDP fields evolve.
5. Timing semantics and DevTools mapping
The DevTools Timing tab presents “request sent,” “waiting (TTFB),” and “content download.” In raw CDP, waiting is represented by the interval from sendEnd to receiveHeadersStart; content download is bounded by response receipt and loading completion. The exact UI grouping is a presentation layer, so retain both phase offsets and lifecycle timestamps.
Total elapsed time comes from protocol monotonic timestamps, not JavaScript wall-clock time. Subtract the matching start and finish timestamps and multiply by 1,000. Do not mix Date.now() with CDP timestamps. The latter are in seconds from a monotonic clock and are suitable for differences within one browser run.
6. Troubleshooting
| Symptom | Likely cause | Fix |
|---|---|---|
| No requests recorded | Network was enabled after navigation. | Create the CDP session and call Network.enable before goto. |
| Missing timing object | Cache, service worker, connection reuse, or protocol behavior. | Handle null; do not infer zero. Run a controlled cold pass if needed. |
| Records stay pending | Long polling, WebSocket, aborted page, or no terminal event before timeout. | Keep unfinished records with a null finish, or stop collection after a defined grace period. |
| Redirect appears as one request | Records were keyed only by URL or the redirect event was ignored. | Close the prior leg when redirectResponse is present and retain each leg. |
| HTTP 404/503 marked failed | Application code equated status errors with transport failure. | Use status for HTTP outcome; reserve loadingFailed for transport/protocol failure. |
| Navigation timeout but useful data exists | networkidle0 never occurs because analytics or sockets remain active. |
Use a shorter wait condition such as domcontentloaded, or collect for a fixed window. |
| Events seem out of order | Extra-info events have independent ordering guarantees. | Merge by requestId and tolerate either arrival order. |
| Browser exits before output | An uncaught navigation or protocol error skipped cleanup. | Wrap navigation in try/finally in long-running services and always close the browser. |
7. Performance, reliability, and cost
CDP event handling is lightweight, but JSON logging for every request can become expensive on media-heavy pages. Keep records in memory for one page, stream summaries for continuous monitoring, and avoid calling page.on('request') and CDP listeners to duplicate the same data. Use one CDP session per page and detach it when a page is retired.
For repeatable comparisons, fix the URL, viewport, browser version, user agent, timezone, and cache state. Run multiple samples and report the distribution rather than a single number. Separate navigation timing from background requests, and set explicit navigation and collection deadlines. Keep loadingFailed records: reliability work needs to see failures, not just successful timings.
The script itself has no service fee; it consumes your own browser CPU, memory, bandwidth, and orchestration time. If you run captures in CI or at many locations, account for browser startup and concurrency limits. Do not interpret one machine’s DNS or TLS phase as a universal Internet benchmark.
8. Or skip the browser setup
If your goal is a clean image or PDF rather than a custom Network waterfall, ScreenshotNeo provides a single screenshot API call and an MCP server. It accepts cookie banners and removes more than 60 known consent platforms, newsletter popups, and chat widgets before capture; each step can be disabled. Bot checks, blank pages, timeouts, failed loads, and cache hits are not billed, and the response identifies the verdict with X-Page-Verdict and X-Billed headers. AI agents can call its take_screenshot, get_page_info, and capture_pdf MCP tools.
See the ScreenshotNeo API documentation for all options. These calls return the image bytes:
cURL
curl -G "https://api.screenshotneo.com/v1/shot" -d access_key=YOUR_API_KEY --data-urlencode url=https://stripe.com -o shot.webpPython
import requests
r = requests.get("https://api.screenshotneo.com/v1/shot", params={"access_key": "YOUR_API_KEY", "url": "https://stripe.com"}, timeout=90)
open("shot.webp", "wb").write(r.content)
Node.js
const q = new URLSearchParams({ access_key: 'YOUR_API_KEY', url: 'https://stripe.com' });
const res = await fetch(`https://api.screenshotneo.com/v1/shot?${q}`);
Every feature is on every plan. The free tier includes 1,000 screenshots per month with no card; paid plans start at $5 for 3,000, and yearly billing gives two months free. Create a free ScreenshotNeo account to get an API key.
9. FAQ
Can I read the response body with this collector?
Yes, but body capture is a separate CDP operation and increases memory and privacy exposure. Timing telemetry only needs response metadata and lifecycle events.
Does a 404 count as a failed request?
It is an HTTP error with a completed response. Keep its status and treat it separately from loadingFailed, which indicates transport or protocol failure.
Why are DNS and TLS values sometimes negative?
Those offsets can be negative or absent when a connection is reused, a cache or worker answers, or the protocol has no new phase. Preserve the raw value and explain the condition in your report.
How do I observe requests from an iframe?
Do not filter to the main frame. Record frameId and group records by frame after collection.
Can I reproduce the DevTools waterfall exactly?
You can reproduce its underlying request events and timings. DevTools then groups and labels them for display, so pixel-level UI parity is not the goal.


