How Cloudflare’s Network Affects Website Screenshots and Monitoring
Learn why Cloudflare screenshots and monitoring vary by location, cache, browser and security state, with a practical diagnostic workflow.

A screenshot or synthetic monitoring result for a Cloudflare-proxied website is the product of several systems: DNS and anycast routing, an edge cache, the origin server, browser behavior, security rules and the capture tool’s own location and settings. Cloudflare does not make every screenshot faster, slower or identical. The same URL can produce different pixels or timings when any of those conditions changes.
The reliable way to investigate is to record the capture environment, establish whether the hostname is proxied, separate cache hits from origin requests, and then compare runs under matched conditions. A result from one probe is evidence about that probe’s path and browser; it is not automatically a result for every visitor.
What changes when a hostname is proxied through Cloudflare?
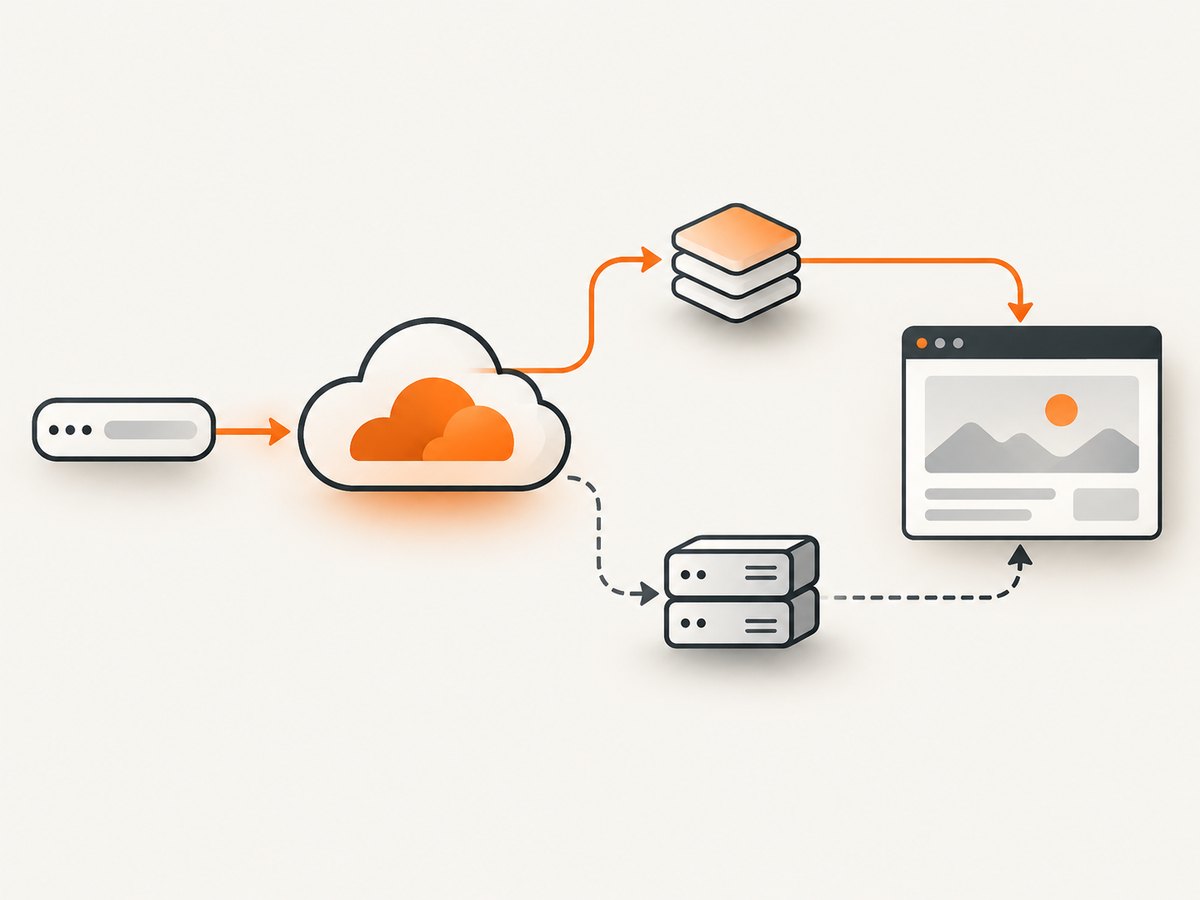
With Cloudflare’s full DNS setup, Cloudflare can be the authoritative DNS provider. An active record marked proxied resolves to a Cloudflare anycast address rather than directly to the origin. Cloudflare describes a reverse proxy as “a network of servers that sits in front of web servers and either forwards requests to those web servers, or handles requests on behalf of the web servers.” The client therefore reaches a Cloudflare edge first. A DNS-only record follows a different path and can expose the origin address or another DNS provider’s answer.
Anycast directs the request toward a Cloudflare edge according to network routing. That edge may return a cached response immediately. If the object is absent, expired, private, or otherwise not cacheable, the edge can continue to the origin. Tiered Cache can add an upper-tier data center between the first edge and the origin. Argo Smart Routing can influence cache misses and non-cacheable traffic when enabled. Consequently, a geographically close edge does not guarantee that every byte came from that edge or that the origin is nearby.
Start a diagnosis by checking the exact DNS record, whether it is proxied, the redirect chain, and the response headers from the hostname you captured. Do not infer the path from the brand name alone.
Why two screenshots can look different
Probe geography and network route
A screenshot service in Virginia, Frankfurt and Singapore can resolve the same anycast hostname to different edges and traverse different peering links. One run may be a warm edge hit while another reaches an upper tier or the origin. Differences in origin latency can change when the browser captures, especially when a page has client-side rendering, web fonts, animations or lazy images.
Cache state and request properties
Cache keys can include the URL, query string, headers, cookies and other rules. A cache hit may return an already generated HTML response; a miss may execute origin logic and produce personalized or time-sensitive content. A response that bypasses cache can also wait for an origin API, image transformation or authentication service. Record cache indicators and compare identical URLs, headers and cookies before attributing a visual change to the edge.
Browser, viewport and device scale
Browser engine and version, viewport dimensions, device pixel ratio, user agent, installed fonts and reduced-motion settings all affect layout. A mobile viewport can activate a different navigation menu. Retina scale changes image dimensions without changing CSS pixels. A screenshot taken before web fonts or hydration completes can contain fallback text or empty components.
Security challenges and personalization
WAF rules, bot checks, rate limits, Turnstile or an interstitial can replace the page with a challenge. Cookies, geolocation, timezone, authorization headers and A/B-test assignments can also change the DOM. A monitor that cannot complete a challenge may report a successful HTTP response while capturing an interstitial. Confirm the visible page and status headers together.
Timing and page state
“Load” can mean navigation complete, network idle, a selector appearing, a fixed delay or a tool-specific heuristic. Streaming HTML, long polling, ads and analytics can prevent network idle. Conversely, a short timeout can capture before lazy images enter the viewport. Use a named wait condition and keep it constant between comparisons.
Cloudflare Browser Run versus an independent capture
Cloudflare documents Browser Run (formerly Browser Rendering) as a globally deployed pool of headless browsers with REST and Workers interfaces for screenshots, PDFs and Playwright automation. Its existence does not prove that an independent screenshot vendor uses Cloudflare or that two browser services have the same network path, browser version or security outcome. Treat the capture provider as a diagnostic variable. For every run, record:
- Capture provider and region (if exposed)
- Browser engine and version, viewport and device scale
- User agent, cookies, authorization and other headers
- URL, redirect chain and timestamp
- Wait condition, timeout and whether cache was reused
- HTTP status, response headers, screenshot and any challenge page
A repeatable diagnostic workflow
- Freeze the request. Use one canonical URL, protocol, query string, headers, cookies, viewport and browser configuration. Save the exact timestamp.
- Confirm DNS and proxy status. Check whether the relevant record is proxied or DNS-only. Resolve it from the same regions as the probes and note the returned address and TTL.
- Inspect the response path. Save redirects, status, cache headers, Cloudflare identifiers and origin-timing headers when available. A cache hit and a miss are different experiments.
- Compare the waterfall. Separate DNS, TCP, TLS, request, first byte, HTML parsing, image/font loads and long-running requests. WebPageTest is useful for detailed waterfalls; PageSpeed Insights combines field and lab performance data; DebugBear provides continuous speed history; Pingdom provides geographic availability and speed checks. Verify current product capabilities before selecting a service.
- Check browser state. Compare the final URL and DOM, not only the bitmap. Look for consent dialogs, WAF challenges, personalization markers, missing fonts and unfinished skeletons.
- Repeat from another region. If only one region differs, investigate route, edge, tier and origin distance. If all regions differ after a deployment, investigate application or cache invalidation.
- Correlate with real users. Field data can show whether a synthetic change represents visitors. Keep synthetic and field measurements separate; they answer different questions.
DIY capture with a browser
The following Playwright example captures the same URL from a controlled browser. It records the response status and waits for a selector so the capture condition is explicit.
import asyncio
from playwright.async_api import async_playwright

URL = "https://example.com"

async def main():
    async with async_playwright() as p:
        browser = await p.chromium.launch()
        page = await browser.new_page(
            viewport={"width": 1440, "height": 900},
            device_scale_factor=1,
            locale="en-US",
            timezone_id="UTC",
        )
        response = await page.goto(URL, wait_until="domcontentloaded", timeout=60000)
        await page.wait_for_load_state("networkidle", timeout=30000)
        await page.screenshot(path="page.png", full_page=True)
        print({"status": response.status if response else None,
               "final_url": page.url})
        await browser.close()

asyncio.run(main())
For production monitoring, replace an unconditional network-idle wait with a page-specific selector such as [data-ready="true"]. Network idle can be unreliable on pages with analytics, chat or streaming requests. Store the HTML, response headers and screenshot together so a later pixel difference has context.
Controlling cache and security variables
- Use a fresh browser context when you need to remove cookies and local storage.
- Use a persistent context when reproducing an authenticated user journey.
- Send the same user agent and viewport for each probe.
- Do not disable security challenges in a test unless that is the behavior you intend to measure.
- Warm and cold cache tests are separate checks; label them explicitly.
Common errors and fixes
| Symptom | Likely cause | Fix |
|---|---|---|
| Screenshot is a Cloudflare challenge | Bot or WAF rule triggered | Review security events, use an authorized test path, and capture after a legitimate challenge flow if your monitor supports it. |
| One region is slow | Different anycast route, upper tier or origin distance | Compare DNS, cache headers, waterfall and origin timing from a second region. |
| Old content after deployment | Edge or browser cache still contains the previous object | Check cache keys and purge or version assets according to your release process; repeat with a labeled cold-cache run. |
| Blank or partial image | Capture occurred before hydration, fonts or lazy images finished | Wait for a readiness selector, image completion or a measured delay; avoid relying only on a fixed short timeout. |
| Mobile and desktop disagree | Responsive CSS, user-agent branching or device scale | Compare the same viewport and user agent, then inspect the DOM at the breakpoint. |
| HTTP check passes but screenshot fails | HTTP client does not execute JavaScript or cannot pass a challenge | Pair an HTTP probe with a real browser probe and alert on the captured content. |
| Intermittent timeouts | Origin slowness, long third-party requests or overloaded probe | Capture phase timings, set a documented timeout, and identify the slow resource in the waterfall. |
Performance, reliability and cost considerations
Cloudflare’s distributed performance guidance emphasizes that device hardware, browser, network quality and topology affect responsiveness. A synthetic number is therefore a controlled vantage point, not a universal user measurement. Keep probe regions and browser versions stable so a change in the measurement setup does not look like a site regression.
For reliability, alert on more than total time. Track DNS and TLS failures, HTTP status, redirect loops, challenge pages, missing readiness selectors and visual diffs. Retain the artifacts needed to reproduce an alert. A cache hit can be fast while serving incorrect content; an origin response can be slower while being correct. Use separate thresholds for availability, freshness and visual completeness.
Cloudflare’s published network figures in the cited material are dated June 2024: more than 330 cities, over 13,000 network peers, over 405 Tbps capacity, and request and threat figures stated for that date. Do not use those numbers as 2026 benchmarks. Likewise, avoid treating a network marketing figure as proof of a particular screenshot latency.
Browser screenshots cost more compute than a simple HEAD or GET check because they launch a browser, execute JavaScript and transfer page resources. Reduce unnecessary work with a sensible viewport, deterministic waits, asset blocking for tests that do not need those assets, and a cache strategy that matches the question. Never block the very resources whose availability you are trying to monitor.
Or skip the browser setup
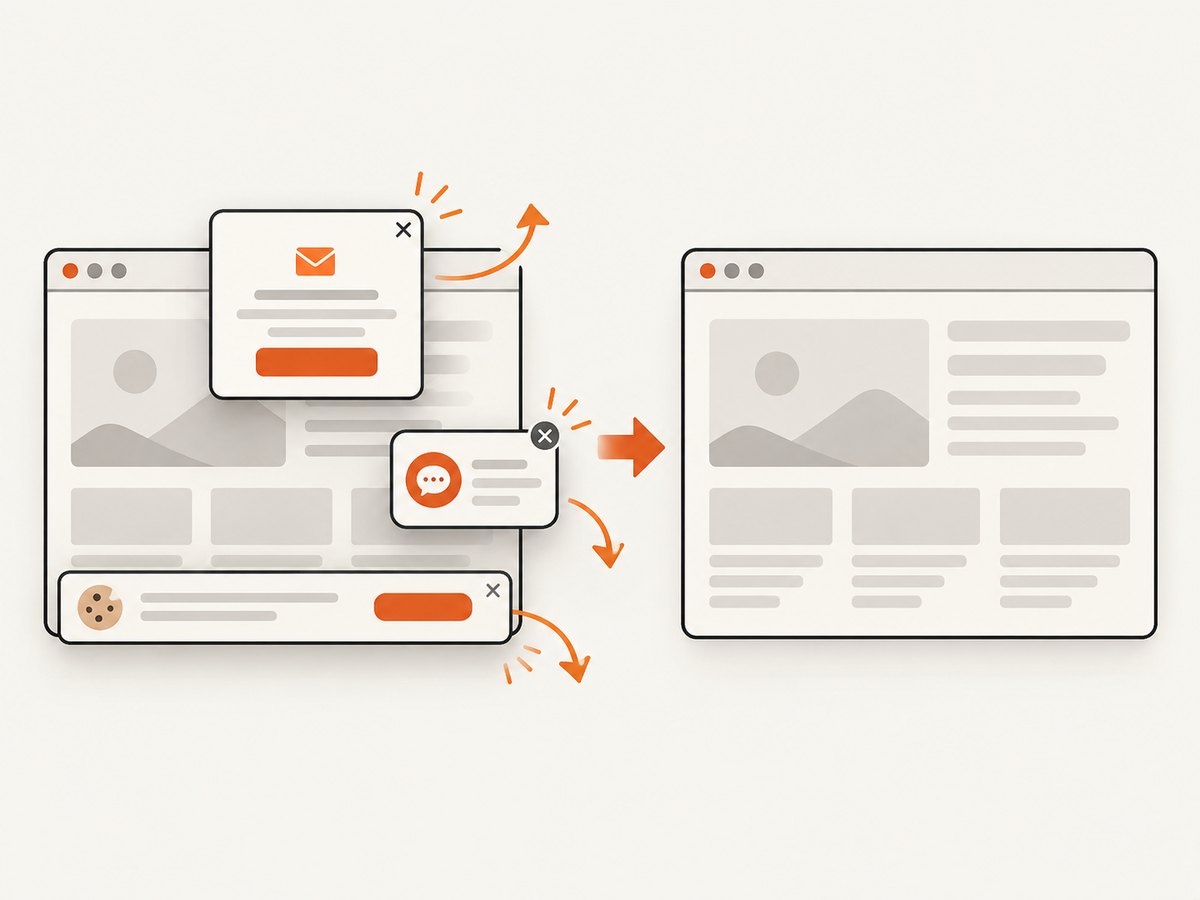
ScreenshotNeo provides a website screenshot API and MCP server. One request returns PNG, JPEG, WebP or PDF. Its clean-shot workflow accepts consent banners and removes more than 60 known consent platforms, newsletter popups and chat widgets before capture; each step can be turned off. Bot checks, blank pages, timeouts, failed loads and cache hits are not billed, and the response identifies the result with X-Page-Verdict and X-Billed headers.
See the complete option list and parameter reference in the ScreenshotNeo documentation. You can set full-page capture with lazy images loaded, an element selector, dark mode, any viewport or one of 12 device presets, retina scale, PDF paper and margins, custom CSS and JavaScript, clicks, selector or network-idle waits, request and resource blocking, headers, cookies, user agent, authorization, timezone, geolocation, transparent backgrounds, resizing, a chosen cache TTL, signed image links, asynchronous webhooks, bulk capture of up to 100 URLs and usage reporting. The API accepts parameter names used by other screenshot services, which helps when switching.
curl -G "https://api.screenshotneo.com/v1/shot" -d access_key=YOUR_API_KEY --data-urlencode url=https://stripe.com -o shot.webpimport requests
r = requests.get("https://api.screenshotneo.com/v1/shot", params={"access_key": "YOUR_API_KEY", "url": "https://stripe.com"}, timeout=90)
open("shot.webp", "wb").write(r.content)const q = new URLSearchParams({ access_key: 'YOUR_API_KEY', url: 'https://stripe.com' });
const res = await fetch(`https://api.screenshotneo.com/v1/shot?${q}`);The MCP server exposes take_screenshot, get_page_info and capture_pdf for Claude, Cursor and other MCP clients, so an AI agent can inspect pages without you maintaining a browser runner. The Free plan includes 1,000 shots per month with no card; paid plans start at $5 for 3,000 shots. Every feature is available on every plan.
Create a free ScreenshotNeo account to start with 1,000 screenshots a month and no card.
FAQ
Does Cloudflare caching change uptime?
It can change what an HTTP or browser probe observes. A cache hit may remain available while the origin is unhealthy, whereas a cache miss exposes origin failure. Decide whether your check measures edge availability, origin health or both.
Why do screenshots differ only in one country?
Investigate that probe’s anycast route, upper-tier path, geolocation, security rules, cookies and browser configuration. Reproduce with the same URL and settings from a second location.
Should I use a browser monitor or an HTTP check?
Use HTTP checks for fast endpoint and status coverage. Add browser checks for JavaScript, layout, consent, authentication and visual completeness. Pair them when both layers matter.
Can a screenshot prove a Cloudflare regression?
No. It shows one capture environment and page state. Compare matched runs, headers, waterfalls, DNS and field data before assigning causality.
What should I save for a visual-diff alert?
Save the image, URL, timestamp, probe region, browser and viewport, response status and headers, cache indicators, redirect chain and wait condition. Those artifacts make the difference reproducible.


