How to Diagnose and Reduce High CPU Usage in Pyppeteer
Find whether Pyppeteer, Chromium, or the page is consuming CPU, then reduce workload safely with profiling, CDP metrics, and lifecycle fixes.

High CPU in Pyppeteer can come from page JavaScript, layout and paint work, network callbacks, Chromium processes, too much concurrency, leaked pages, or deployment limits. Measure each process during a repeatable navigation first. Then use a performance trace and Chrome DevTools Protocol metrics to identify the workload, reduce only nonessential resources, keep Chromium and Pyppeteer versions aligned, and close every browser object on every path.
There is no launch flag that reliably lowers CPU for every page. Treat flags and request blocking as controlled experiments: record CPU, latency, errors, process count, and functional correctness before and after each change.
1. Establish a repeatable CPU baseline
Run the same URL and actions at least three times. Separate startup from steady-state work by recording both the navigation interval and an idle interval after the page settles.
- Record Python, browser, renderer, and GPU process CPU separately with your operating-system tools.
- Log the Pyppeteer version, Chromium version, headless mode, launch arguments, viewport, URL class, and concurrency.
- Use a fixed navigation timeout and a fixed post-navigation wait so runs are comparable.
- Keep a functional assertion, such as the presence of a required selector or extracted value.
On Linux, ps, top, or pidstat can show process-level CPU. On macOS, Activity Monitor or ps provides the same separation. Record the browser PID and its child processes; a high Python percentage does not prove that Python is doing the expensive work.
2. Profile the page with Chrome DevTools
Chrome DevTools’ Performance panel is designed to expose runtime bottlenecks through recordings and flame charts. Record the navigation and the period in which CPU is high, then inspect the main-thread track.
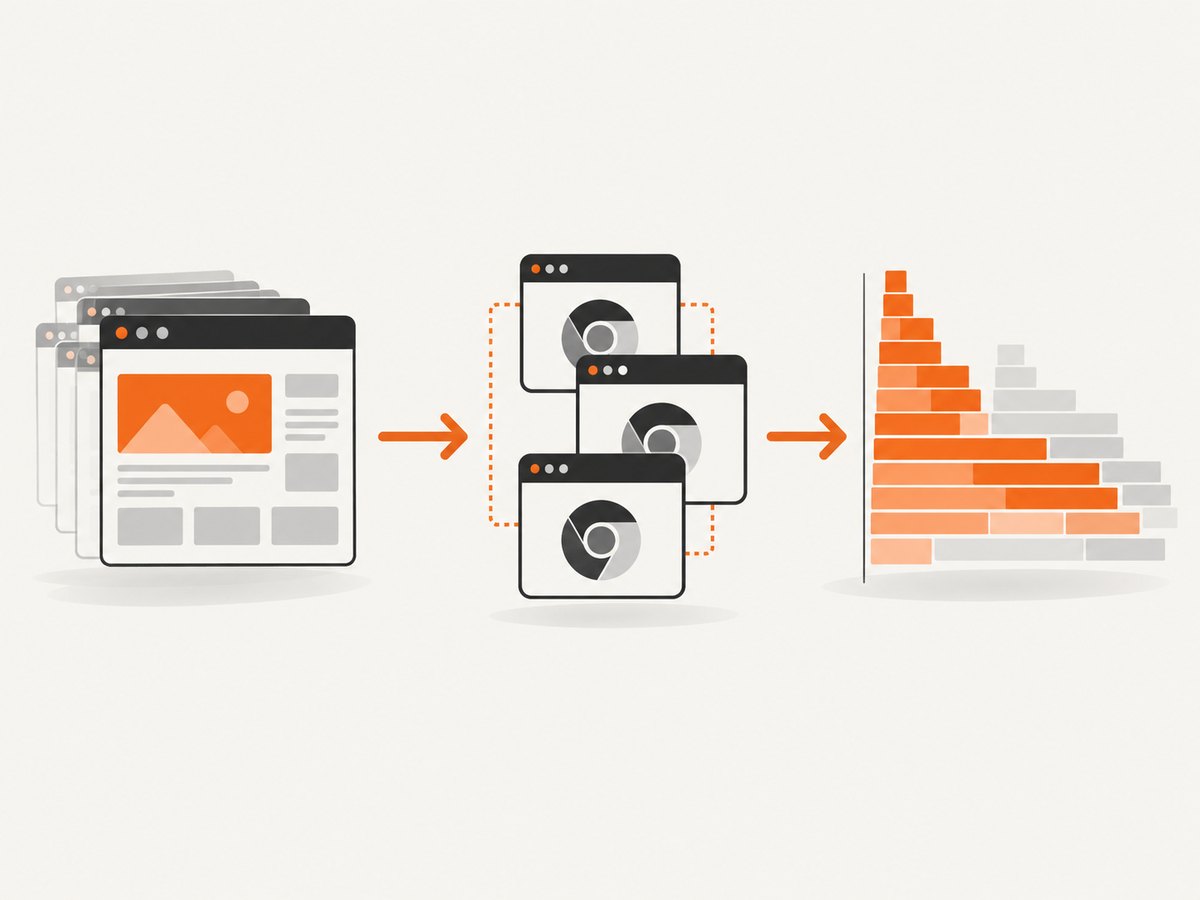
- Long JavaScript tasks: look for application code, timers, polling loops, or third-party scripts.
- Recalculate Style and Layout: repeated DOM changes can force synchronous layout.
- Paint and Raster: animations, large canvases, shadows, filters, and continuously changing content can keep renderer threads busy.
- Network-driven callbacks: analytics, ads, chat, and live updates can continue after the page appears loaded.
- Frames and animations: an always-running animation may consume CPU even when no user action occurs.
Use DevTools CPU throttling only for relative experiments. Throttling is relative to the host machine, so it is not a production benchmark. See the Chrome DevTools Performance guide.
3. Add repeatable CDP metrics
Pyppeteer exposes the underlying Chrome DevTools Protocol connection. Enable the Performance domain and sample metrics at the same checkpoints on every run.
import asyncio
import json
import time
from pyppeteer import launch

URL = "https://example.com"

async def metrics(page, label):
    client = await page.target.createCDPSession()
    await client.send("Performance.enable")
    result = await client.send("Performance.getMetrics")
    values = {item["name"]: item["value"] for item in result["metrics"]}
    print(json.dumps({"label": label, "time": time.time(), "metrics": values}))
    await client.detach()

async def main():
    browser = await launch(headless=True)
    page = await browser.newPage()
    try:
        await metrics(page, "before_navigation")
        await page.goto(URL, {"waitUntil": "networkidle2", "timeout": 60000})
        await metrics(page, "after_navigation")
        await asyncio.sleep(5)
        await metrics(page, "after_idle")
    finally:
        await page.close()
        await browser.close()

asyncio.get_event_loop().run_until_complete(main())
The protocol returns named runtime metrics and values. Store the samples with timestamps and your run configuration so regressions can be compared. The CDP Performance domain documents Performance.enable, Performance.getMetrics, and metric events.
4. Reduce workload with request interception
Block one resource class at a time and rerun your functional assertion. Images, stylesheets, fonts, media, ads, analytics, and trackers are common candidates, but blocking a resource that supplies data or layout can invalidate the result.
import asyncio
from pyppeteer import launch

BLOCKED_TYPES = {"image", "media", "font"}
BLOCKED_HOST_PARTS = {"google-analytics.com", "doubleclick.net"}

async def main():
    browser = await launch(headless=True)
    page = await browser.newPage()
    await page.setRequestInterception(True)

    async def handle_request(request):
        resource = request.resourceType
        url = request.url.lower()
        if resource in BLOCKED_TYPES or any(host in url for host in BLOCKED_HOST_PARTS):
            await request.abort()
        else:
            await request.continue_()

    page.on("request", lambda request: asyncio.ensure_future(handle_request(request)))
    try:
        await page.goto("https://example.com", {"waitUntil": "networkidle2", "timeout": 60000})
        required = await page.querySelector("body")
        if required is None:
            raise RuntimeError("Required content is missing")
    finally:
        await page.close()
        await browser.close()

asyncio.get_event_loop().run_until_complete(main())
For image-only experiments, CDP also exposes Emulation.setDisabledImageTypes. DevTools request conditions describe blocking and throttling selected requests. See the Emulation domain and request conditions documentation.
Choose blocking rules deliberately
| Resource | Potential CPU benefit | Risk |
|---|---|---|
| Images | Less decode, layout, paint, and raster work | Missing visual content or changed layout |
| Media | Stops video and audio processing | Tests no longer represent the real page |
| Fonts | Less font download and raster work | Different metrics and line wrapping |
| Analytics and ads | Removes third-party scripts and timers | Some pages depend on third-party callbacks |
| Stylesheets | Can reduce style and layout work | Usually breaks visual fidelity |
5. Check browser and Pyppeteer compatibility
Pyppeteer works best with its bundled Chromium revision. If you use a system browser through executablePath, pin and record its version and verify that your Pyppeteer release supports it.
import asyncio
from pyppeteer import launch

async def main():
    browser = await launch(
        headless=True,
        executablePath="/usr/bin/google-chrome",
        args=["--window-size=1280,900"],
        dumpio=False,
    )
    try:
        print(await browser.version())
    finally:
        await browser.close()

asyncio.get_event_loop().run_until_complete(main())
Pyppeteer’s API documents executablePath, args, logging, and lifecycle options. A Pyppeteer issue describes launch problems with a newer Chrome and a compatible executable workaround; that report is anecdotal and does not establish a CPU improvement. Pin versions and test upgrades as compatibility changes.
Launch flags: what to test and what not to assume
- Pass one additional Chromium argument at a time and keep a rollback.
- Do not use
ignoreDefaultArgsunless you understand which defaults you are removing. --no-sandboxdisables Chromium sandboxing for processes that would normally be sandboxed. Use it only when the environment cannot support the sandbox, document the security trade-off, and never present it as a generic CPU optimization.
6. Fix lifecycle leaks and bound concurrency
Always close pages and browsers in finally blocks. Reuse a bounded browser or page pool instead of launching one browser per URL. Monitor process counts over hours; a growing set of Chrome children indicates a leak or zombie-process problem.
import asyncio
from pyppeteer import launch

MAX_PAGES = 4

async def capture(browser, url, semaphore):
    async with semaphore:
        page = await browser.newPage()
        try:
            await page.goto(url, {"waitUntil": "networkidle2", "timeout": 60000})
            return await page.title()
        finally:
            await page.close()

async def main():
    browser = await launch(headless=True)
    semaphore = asyncio.Semaphore(MAX_PAGES)
    urls = ["https://example.com", "https://www.python.org"]
    try:
        results = await asyncio.gather(
            *(capture(browser, url, semaphore) for url in urls),
            return_exceptions=True,
        )
        print(results)
    finally:
        await browser.close()

asyncio.get_event_loop().run_until_complete(main())
Use a pool size that your CPU quota can sustain. More pages increase throughput only until renderer contention, memory pressure, or garbage collection dominates. In containers, use an init process suitable for PID 1 and inspect for orphaned Chrome processes; Puppeteer troubleshooting specifically calls out zombie processes and init handling.
7. Check containers and serverless CPU limits
- Confirm
/dev/shmsizing and sandbox permissions. - Check the container CPU quota rather than comparing percentages from machines with different allocations.
- Verify whether your platform disables CPU after an HTTP response. On Cloud Run, background browser work can appear stalled when CPU is removed after the request finishes.
- Separate browser startup cost from steady-state page work when evaluating cold starts.
These are deployment effects, not Pyppeteer’s algorithmic CPU reductions. Puppeteer’s troubleshooting guide covers container privileges, init processes, and serverless CPU allocation.
8. Run controlled experiments
- Baseline with the full page and your real assertion.
- Block images only; compare CPU, wall time, errors, and output correctness.
- Test media, fonts, analytics, ads, and trackers separately.
- Compare bundled Chromium with a pinned system executable.
- Compare one long-lived browser with a bounded page pool.
- Test candidate launch flags one at a time.
Keep a small experiment log:
| Run | Change | Python CPU | Renderer CPU | Wall time | Errors | Assertion |
|---|---|---|---|---|---|---|
| baseline | none | record | record | record | record | pass/fail |
| test-1 | images blocked | record | record | record | record | pass/fail |
Accept a change only when it lowers the relevant workload without breaking the page behavior you need. The available sources provide measurement and configuration mechanisms, not a universal CPU threshold or percentage reduction.
9. Or skip the browser setup
ScreenshotNeo provides a website screenshot API and MCP server when you need rendered images or PDFs without maintaining Chromium. Cookie and consent banners are accepted and removed before capture, along with more than 60 known consent platforms, newsletter popups, and chat widgets; each cleanup step can be turned off. Bot checks, blank pages, timeouts, failed loads, and cache hits are not billed, and the response identifies the result with X-Page-Verdict and X-Billed headers. Its MCP server provides take_screenshot, get_page_info, and capture_pdf for Claude, Cursor, and other MCP clients.

See the ScreenshotNeo API documentation for all options.
cURL
curl -G "https://api.screenshotneo.com/v1/shot" -d access_key=YOUR_API_KEY --data-urlencode url=https://stripe.com -o shot.webpPython
import requests
r = requests.get("https://api.screenshotneo.com/v1/shot", params={"access_key": "YOUR_API_KEY", "url": "https://stripe.com"}, timeout=90)
open("shot.webp", "wb").write(r.content)
Node.js
const q = new URLSearchParams({ access_key: 'YOUR_API_KEY', url: 'https://stripe.com' });
const res = await fetch(`https://api.screenshotneo.com/v1/shot?${q}`);
ScreenshotNeo supports full-page and element capture, dark mode, device presets and custom viewports, retina scale, PDF settings, custom CSS and JavaScript, clicks, selector waits, delays, network-idle waits, request blocking, headers, cookies, user agents, authorization, timezone, geolocation, transparent backgrounds, resizing, caching with a chosen TTL, signed links, asynchronous jobs with signed webhooks, bulk capture of 100 URLs per call, a usage API, and an OpenAPI specification. Parameter names used by other screenshot APIs also work.
There are 1,000 free screenshots each month with no card. Paid plans start at $5 for 3,000 screenshots; every feature is included on every plan. Create a free ScreenshotNeo account.
10. Troubleshooting
| Symptom | Likely cause | Fix |
|---|---|---|
| One renderer is near 100% | Page JavaScript, animation, layout, or paint | Record a Performance trace; inspect long tasks, layout, paint, and animation tracks. |
| Python is high but Chrome is low | Automation loop, parsing, image processing, or excessive callbacks | Profile Python separately and reduce polling or post-processing. |
| CPU remains high after navigation | Timers, live updates, ads, chat, or animation | Capture an idle trace; block nonessential third-party resources one class at a time. |
| CPU drops but output is wrong | Required images, CSS, fonts, or data were blocked | Restore that resource class and keep a functional assertion. |
| Launch fails after Chrome upgrade | Pyppeteer and executable version mismatch | Use the bundled revision or pin a compatible system executable; record versions. |
| Many Chrome processes accumulate | Pages or browsers are not closed, or PID 1 does not reap children | Close in finally, bound concurrency, configure a container init process, and inspect orphan processes. |
| Browser work stalls in serverless | CPU is removed after the request returns | Keep work inside the billed request or configure the platform’s CPU behavior. |
--no-sandbox seems to help launch |
Sandbox permissions are unavailable | Fix container permissions where possible; use the flag only with its documented security trade-off. |
| Metrics differ between runs | Different startup state, URL content, timing, or concurrency | Fix checkpoints, repeat at least three times, and log all run configuration. |
11. Performance, reliability, and cost notes
- Performance: Reusing a bounded browser avoids repeated startup, while too much concurrency creates renderer contention. Measure wall time and CPU together.
- Reliability: Pin browser versions, set explicit timeouts, close objects in
finally, and preserve assertions after every optimization. - Resource fidelity: Blocking requests is a workload experiment. Keep separate profiles for visual-fidelity captures and lightweight data extraction.
- Cost: Local Pyppeteer cost depends on your compute allocation and browser runtime. ScreenshotNeo charges only clean shots; bot checks, blank pages, timeouts, failed loads, and cache hits cost nothing. Cache TTL, async jobs, and bulk capture can reduce repeated work.
12. FAQ
Does --no-sandbox reduce CPU?
The cited Chromium documentation defines its security behavior, not a universal CPU benefit. Use it only when sandboxing cannot work in your environment.
Should I block all images?
Only when your task does not require visual fidelity or image-driven layout. Test image blocking separately and keep a content assertion.
How do I know whether Chromium or the page is responsible?
Correlate operating-system process data with a DevTools Performance recording and CDP Performance metrics. Renderer flame-chart activity points to page work; Python-only activity points to automation or processing.
Is a lower CPU percentage always better?
No. Compare CPU with wall time, error rate, process count, and required output. A slower run or broken page is not an optimization.
When should I replace Pyppeteer?
If maintaining Chromium versions, cleanup, concurrency, and deployment permissions costs more than the capture workflow, an API such as ScreenshotNeo can remove that browser operations work while still providing capture controls.