Edge DevTools MCP: Connect Microsoft Edge to AI Coding Agents
Configure Chrome DevTools MCP for Microsoft Edge or WebView2, choose the right connection mode, secure your session, and troubleshoot common failures.

Edge DevTools MCP usually means configuring the Chrome DevTools MCP server to control Microsoft Edge or a WebView2 application. It is not a separately documented Microsoft product with that exact name. The server exposes browser automation, debugging, and performance analysis to an MCP-capable coding agent.
Microsoft documents three ways to connect:
- Let the MCP server launch Edge.
- Attach to an existing Edge session with remote debugging.
- Attach to a WebView2 host with remote debugging.
The setup needs Node.js (latest LTS), npm, an installed Edge channel, and an MCP-capable agent such as a client that supports local MCP servers. Microsoft describes the integration as giving an AI coding assistant access to Edge DevTools for “reliable automation, in-depth debugging, and performance analysis.” Microsoft’s setup guide
How Edge DevTools MCP works
Edge implements the same DevTools Protocol APIs as Chrome. The MCP server uses Puppeteer and talks to the browser’s DevTools endpoint. When attaching to an existing browser, the endpoint exposes targets through the DevTools Protocol; the server can discover the running instance using the DevToolsActivePort file when you provide a user-data directory. Edge DevTools Protocol reference
Once connected, your agent can navigate pages, take snapshots and screenshots, inspect the DOM and network activity, debug JavaScript, and analyze performance. The agent still needs a clear prompt describing the target URL and action.
Prerequisites
- Install the latest Node.js LTS, which includes npm.
- Install Microsoft Edge Stable, Beta, Dev, or another supported Chromium channel.
- Choose an MCP-capable coding agent and locate its MCP configuration file.
- Decide whether the server should launch a fresh browser, reuse a signed-in profile, or connect to a WebView2 host.
Check your runtime before configuring the server:

node --version
npm --version
Option 1: Let MCP launch Microsoft Edge
This is the simplest setup for a clean, repeatable browser. Configure the Edge executable path and run the server with npx. Microsoft documents optional --headless, --isolated, and --viewport=1280x720 flags.
Find the Edge executable
Microsoft lists default Stable locations for Windows, macOS, and Linux, but installation policy and channel change the path. Verify the path on your machine rather than copying a path blindly. Typical examples are:
Windows:
C:\Program Files (x86)\Microsoft\Edge\Application\msedge.exe

macOS:
/Applications/Microsoft Edge.app/Contents/MacOS/Microsoft Edge

Linux:
/usr/bin/microsoft-edge
Generic MCP server configuration
Most clients use an mcpServers object. The exact file location and wrapper differ by client, so use that client’s documentation for placement.
{
  "mcpServers": {
    "edge-devtools": {
      "command": "npx",
      "args": [
        "-y",
        "chrome-devtools-mcp@latest",
        "--executablePath=/usr/bin/microsoft-edge",
        "--isolated",
        "--viewport=1280x720"
      ]
    }
  }
}
On Windows, escape backslashes correctly in JSON:
{
  "mcpServers": {
    "edge-devtools": {
      "command": "npx",
      "args": [
        "-y",
        "chrome-devtools-mcp@latest",
        "--executablePath=C:\\Program Files (x86)\\Microsoft\\Edge\\Application\\msedge.exe"
      ]
    }
  }
}
For a headless run, add --headless. For a temporary profile that is not reused between runs, add --isolated. Use a viewport that matches the page layout you are diagnosing.
Option 2: Attach to an existing Edge session
Use this mode when the page is already open or when you need an existing signed-in session. Start Edge with remote debugging enabled, then configure --autoConnect and the matching user-data directory.
Start Edge with remote debugging
Close the target Edge instance first, then launch it with a debugging port and a dedicated profile directory. A separate profile prevents accidental reuse of your everyday browser data.
microsoft-edge --remote-debugging-port=9222 --user-data-dir=/tmp/edge-mcp-profileOn Windows, use the full executable path and quote paths containing spaces:
"C:\Program Files (x86)\Microsoft\Edge\Application\msedge.exe" --remote-debugging-port=9222 --user-data-dir="C:\temp\edge-mcp-profile"Microsoft also documents enabling remote debugging through edge://inspect. Confirm that the selected Edge channel is the one you intend to control.
Configure auto-connect
{
  "mcpServers": {
    "edge-devtools": {
      "command": "npx",
      "args": [
        "-y",
        "chrome-devtools-mcp@latest",
        "--autoConnect",
        "--user-data-dir=/tmp/edge-mcp-profile"
      ]
    }
  }
}
Security warning for live profiles
Auto-connect gives the agent access to the active browser session, including logged-in accounts, cookies, and data exposed through JavaScript APIs. Microsoft recommends using this mode only with agents you trust and being careful with prompts. Prefer a dedicated profile with limited permissions for automation. The --isolated launch option reduces profile reuse, but it is not a complete security guarantee.
Option 3: Connect to a WebView2 host
WebView2 applications embed the Edge rendering engine. To connect, enable remote debugging for the host’s WebView2 instance, identify its user-data directory, and pass --autoConnect with that directory.
Microsoft notes that the relevant profile directory commonly ends with EBWebView. If you derive the path from application source code, append that suffix where required by the host’s profile layout.
{
  "mcpServers": {
    "webview2-devtools": {
      "command": "npx",
      "args": [
        "-y",
        "chrome-devtools-mcp@latest",
        "--autoConnect",
        "--user-data-dir=C:\\path\\to\\WebView2\\EBWebView"
      ]
    }
  }
}
Restart the WebView2 host after changing its debugging configuration. The host executable name and registry settings must match the application you are inspecting.
Configure common MCP clients
VS Code-style configuration
Microsoft’s VS Code example uses a servers object and type: "stdio":
{
  "servers": {
    "edge-devtools": {
      "type": "stdio",
      "command": "npx",
      "args": ["-y", "chrome-devtools-mcp@latest", "--executablePath=/usr/bin/microsoft-edge"]
    }
  }
}
Copilot CLI-style configuration
The Copilot CLI example uses mcpServers and type: "local":
{
  "mcpServers": {
    "edge-devtools": {
      "type": "local",
      "command": "npx",
      "args": ["-y", "chrome-devtools-mcp@latest", "--executablePath=/usr/bin/microsoft-edge"]
    }
  }
}
Other clients generally use an mcpServers wrapper without a type field. Validate the schema, file location, and restart behavior in your client’s documentation.
Useful prompts for the connected agent
Navigate to https://contoso.com and take a screenshot.

Take a snapshot of the current page and list the console errors.

Open https://contoso.com, inspect the network requests, and identify failed resources.

Measure the page performance, then explain the largest blocking resources.
Give the agent one target and one observable outcome per prompt. For repeatable work, specify the URL, viewport, authentication state, and the exact evidence you want returned.
Verify the DevTools connection directly
The DevTools Protocol exposes attachable targets through a local HTTP endpoint. With a browser running on port 9222, inspect the target list:
curl http://127.0.0.1:9222/json/listEach target can include a webSocketDebuggerUrl. The MCP server handles the WebSocket connection, so you normally do not need to implement the protocol yourself. This check distinguishes a browser/debugging problem from an MCP client configuration problem.
Or skip the browser setup
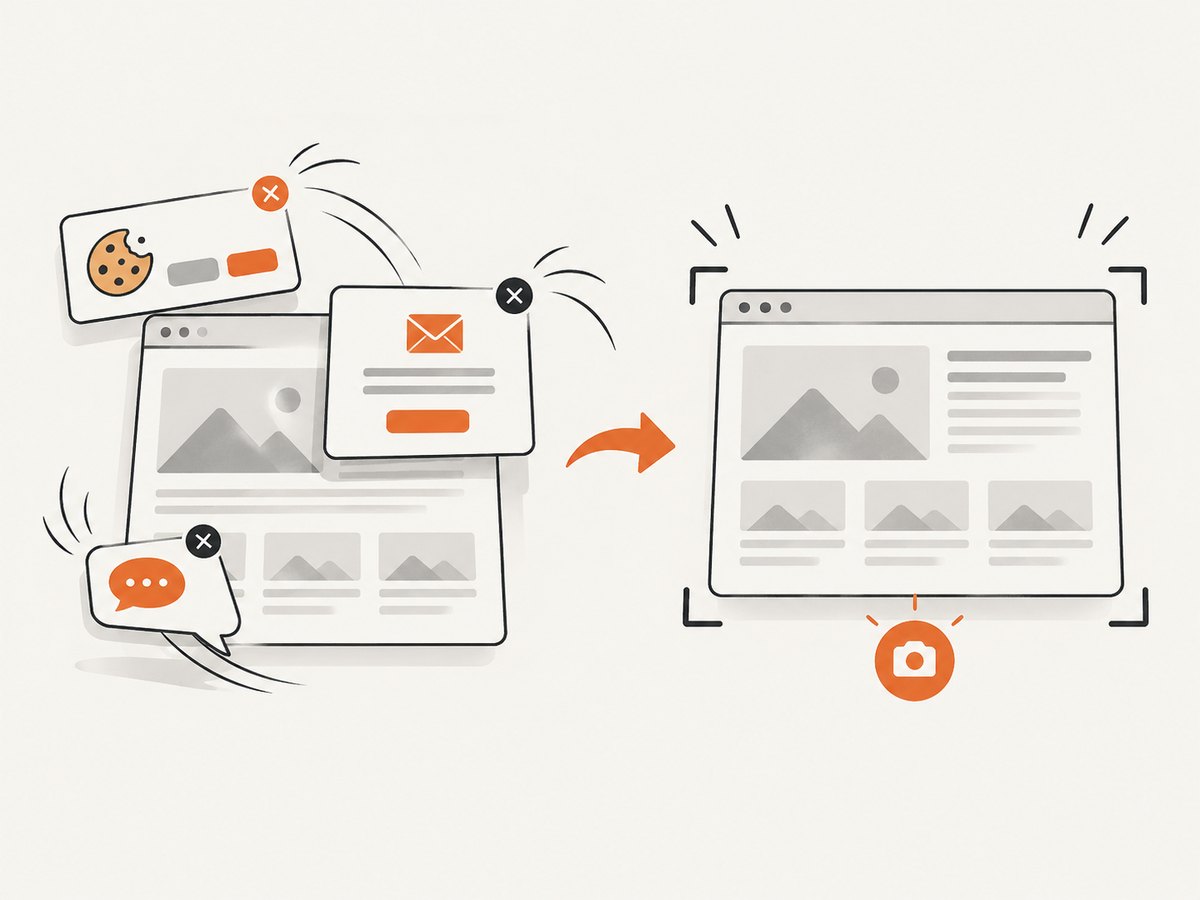
If your goal is a clean website image or PDF rather than interactive debugging, ScreenshotNeo provides a single HTTP request to capture a URL. Its consent step accepts cookie banners and removes more than 60 known consent platforms, newsletter popups, and chat widgets before capture; each step can be disabled. Bot checks, blank pages, timeouts, failed loads, and cache hits are not billed, and response headers identify the page verdict and billing result.
See the ScreenshotNeo API documentation for all options.
cURL
curl -G "https://api.screenshotneo.com/v1/shot" -d access_key=YOUR_API_KEY --data-urlencode url=https://stripe.com -o shot.webpPython
import requests
r = requests.get("https://api.screenshotneo.com/v1/shot", params={"access_key": "YOUR_API_KEY", "url": "https://stripe.com"}, timeout=90)
open("shot.webp", "wb").write(r.content)
Node.js
const q = new URLSearchParams({ access_key: 'YOUR_API_KEY', url: 'https://stripe.com' });
const res = await fetch(`https://api.screenshotneo.com/v1/shot?${q}`);
ScreenshotNeo also supports full-page captures with lazy images loaded, element selectors, dark mode, device presets, custom viewports, retina scale, PDFs, custom CSS and JavaScript, clicks, waits, blocked resources, headers, cookies, user agents, authorization, timezone, geolocation, transparent backgrounds, resizing, TTL caching, signed image links, asynchronous jobs, signed webhooks, bulk capture, usage reporting, and an OpenAPI specification. An MCP server provides take_screenshot, get_page_info, and capture_pdf tools for Claude, Cursor, and other MCP clients.
There is a free plan with 1,000 screenshots per month and no card. Paid plans start at $5 for 3,000 screenshots; every feature is available on every plan. Create a free ScreenshotNeo account.
Troubleshooting
“Could not connect to Chrome”
- Cause: Edge is not running with remote debugging, or the server is pointed at the wrong profile.
- Fix: Start Edge with
--remote-debugging-port, verify--user-data-dir, and check thatDevToolsActivePortexists in that profile.
Edge cannot be found
- Cause: The executable path is wrong, the channel differs, or Windows JSON escaping is invalid.
- Fix: Locate the installed binary, use the correct channel path, quote paths with spaces, and double every backslash in JSON strings.
The agent connects to the wrong browser
- Cause: Multiple Edge channels or profiles are running.
- Fix: Close unrelated instances, use a dedicated
--user-data-dir, and specify the exact executable with--executablePath.
Authentication disappeared
- Cause: The server launched an isolated or new profile.
- Fix: Use auto-connect with the intended profile, or sign in inside the dedicated automation profile. Treat that profile as sensitive.
WebView2 does not connect
- Cause: Remote debugging is disabled, the registry key names the wrong host executable, or the profile path lacks
EBWebView. - Fix: Verify the host executable name, restart the host after changing the registry setting, and confirm the derived user-data directory.
The MCP client shows no tools
- Cause: Invalid JSON, the wrong configuration wrapper, or a client that has not been restarted.
- Fix: Validate JSON, match the client’s documented
servers/mcpServersformat, and restart the client. Runnpx -y chrome-devtools-mcp@latestmanually to surface npm or Node errors.
Performance and reliability guidance
- Use a fixed viewport when comparing screenshots or layout changes.
- Use a dedicated profile for deterministic cookies, extensions, and permissions.
- Prefer headless mode for unattended CI when visual browser interaction is unnecessary.
- Keep prompts narrow and request evidence such as console errors, failed requests, or a screenshot.
- Do not assume a page is ready immediately after navigation; ask the agent to wait for a selector or network activity to settle.
- For production screenshot pipelines, an HTTP screenshot API avoids browser process management. ScreenshotNeo supports waits, blocking rules, caching with a chosen TTL, asynchronous jobs, signed webhooks, and bulk capture up to 100 URLs per call.
Choosing the right connection mode
| Mode | Best for | Main setup | Primary risk |
|---|---|---|---|
| Server launches Edge | Fresh, repeatable automation | --executablePath |
Incorrect binary path |
| Auto-connect to Edge | Existing tabs or signed-in state | Remote debugging plus --user-data-dir |
Agent can access session data |
| Auto-connect to WebView2 | Desktop apps embedding Edge | Host debugging plus WebView2 profile | Wrong host or profile path |
FAQ
Is Edge DevTools MCP a separate Microsoft package?
No. The documented approach uses Chrome DevTools MCP configured for Chromium-based Edge or WebView2.
Can I keep my normal Edge profile?
You can attach to it, but the agent may access its logged-in accounts, cookies, and page data. A dedicated profile is safer for automation.
Does this work with WebView2?
Yes, when the host enables remote debugging and the MCP server receives the correct WebView2 user-data directory, commonly ending in EBWebView.
When should I use ScreenshotNeo instead?
Use ScreenshotNeo when you need an image or PDF from a URL without maintaining a local Edge process, profile, or DevTools connection. Its free plan includes 1,000 screenshots each month without a card.
Where is the protocol documented?
See Microsoft’s Edge DevTools Protocol documentation and the Chrome DevTools MCP setup guide.