How Enterprise Website Monitoring Helps Detect Website Issues
Learn how synthetic checks, browser journeys, RUM and diagnostic telemetry reveal website failures before they become customer incidents.
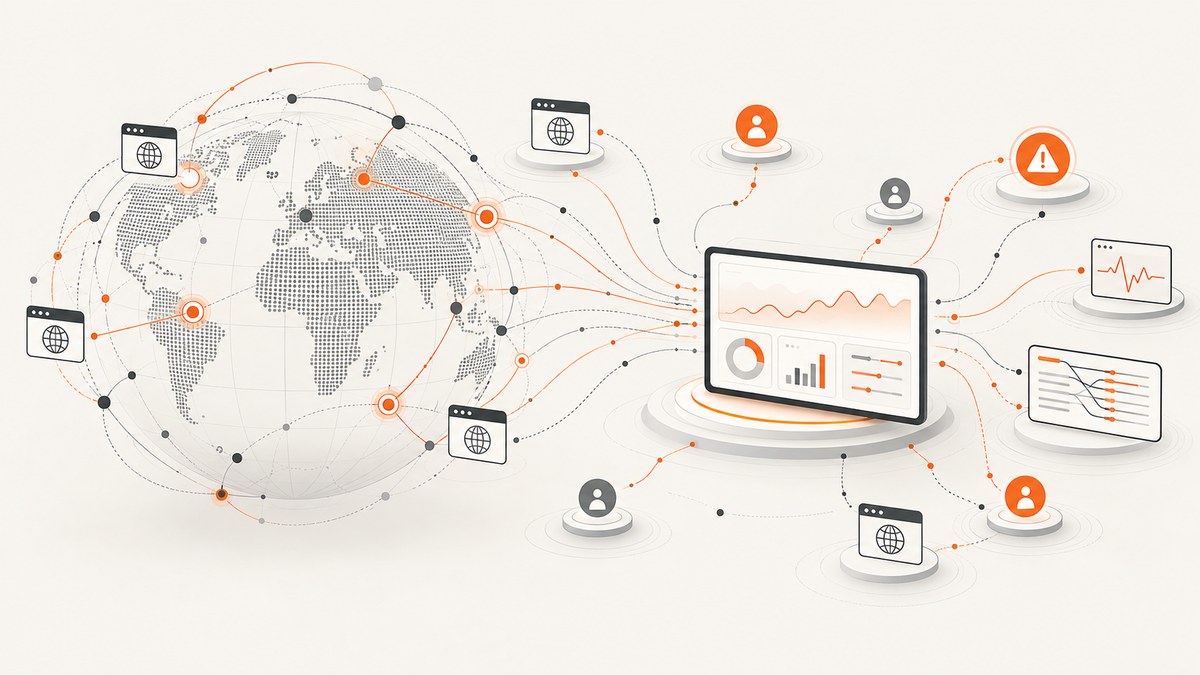
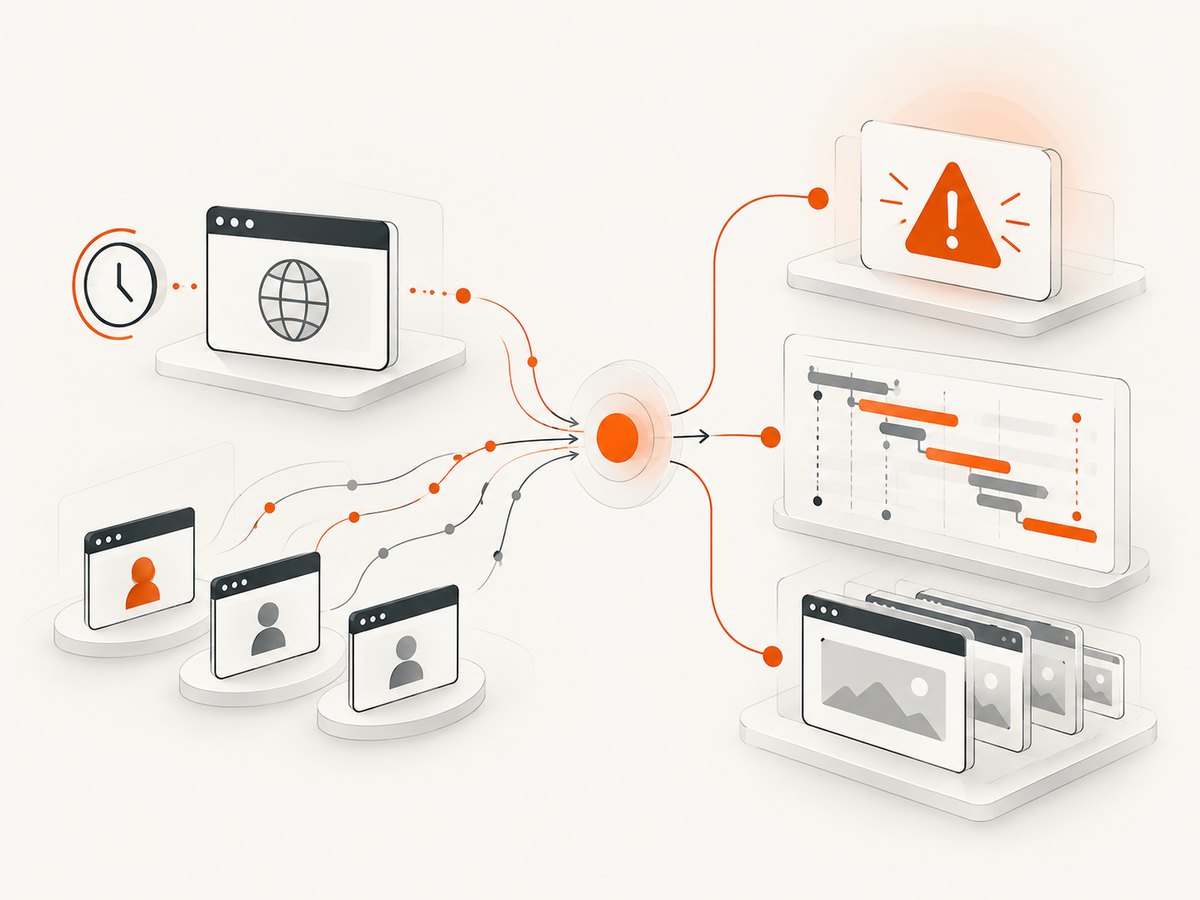
Enterprise website monitoring combines scheduled synthetic checks, real-user monitoring (RUM), alerts and diagnostic telemetry. Synthetic checks tell you that an expected endpoint or journey is failing, often before a customer encounters it. RUM tells you whether real customers are affected, where they are located, which browsers they use and what they experienced. Traces, logs and screenshots help responders find the cause.
The reliable operating model is to use both signals. A simple HTTP ping is a useful first alarm, but it cannot prove that JavaScript rendered, a user authenticated or checkout completed. New Relic describes this limitation directly: a ping “detects outages, not broken functionality,” so treat it as a first signal rather than proof that the application works. New Relic synthetic monitoring use cases
What enterprise monitoring detects
| Signal | What it verifies | What it can miss | Use it for |
|---|---|---|---|
| HTTP availability check | DNS, connection, status code, response time and optionally response text | Broken JavaScript, missing assets, unusable forms and failed transactions | Many lightweight endpoints and fast outage detection |
| Content or browser check | Rendered page elements, scripts, assets and expected content | Problems outside the selected page or journey | Home pages, search results and important landing pages |
| Scripted browser journey | Multi-step actions such as sign-in, search and checkout | Unselected paths, rare data combinations and unsampled customers | Revenue and trust critical workflows |
| RUM | Actual page-load times, client errors, browsers, devices, locations and session behavior | Users who are not sampled or pages without instrumentation | Measuring customer impact and discovering unknown patterns |
AWS CloudWatch Synthetics canaries monitor APIs, URLs and website content, retain load-time data and screenshots, and can run as often as once per minute. AWS CloudWatch Synthetics documentation CloudWatch RUM observes real sessions, including page-load performance and client-side errors, and can help break impact down by geography and browser/device. RUM session data is retained for 30 days by default unless copied to CloudWatch Logs with a separately configured retention period. AWS CloudWatch RUM documentation
A reference architecture for detection and diagnosis
- Schedule checks. Run lightweight HTTP checks frequently and browser checks on the workflows that matter most. Include low-traffic periods so a quiet hour does not hide a regression.
- Choose locations and network paths. Probe from the regions where customers live. Use private locations or an equivalent network path for internal applications; a public probe cannot reach a private service.
- Record evidence. Store status, latency phases, response assertions, browser console errors, screenshots and a correlation identifier for each run.
- Instrument real sessions. Install RUM and choose a session-sampling percentage. Sampling controls cost and volume, but it also limits the population represented by the data.
- Alert on sustained symptoms. Combine consecutive failures, latency thresholds and error-rate changes. Route alerts to the team that owns the affected service.
- Trace the incident. Correlate the check timestamp and identifier with application metrics, logs, distributed traces and service maps. AWS reliability guidance recommends including synthetic canaries and RUM in end-to-end tracing. AWS REL06-BP07
Build a monitoring program step by step
1. Inventory customer journeys
List public pages, APIs and workflows that affect revenue, account access or trust. For each one, write the expected status, visible success condition, maximum acceptable latency and owner. Include dependencies such as identity providers, payment gateways and search services.
2. Start with a scheduled HTTP check
An HTTP check is inexpensive and easy to scale across many endpoints. Assert the status code, a short response-body token and a response-time threshold. Keep the body assertion specific enough to catch an error page, but avoid matching content that changes on every request.
import time
import requests

URL = "https://example.com/health"
start = time.perf_counter()
r = requests.get(URL, timeout=15)
elapsed_ms = (time.perf_counter() - start) * 1000

if r.status_code != 200:
    raise RuntimeError(f"status={r.status_code}")
if "healthy" not in r.text:
    raise RuntimeError("health marker missing")
if elapsed_ms > 1000:
    raise RuntimeError(f"slow response: {elapsed_ms:.0f} ms")
print({"status": r.status_code, "elapsed_ms": round(elapsed_ms)})
Run this from a scheduler or synthetic-monitoring service rather than a developer laptop. Add retries only when they represent a realistic user retry; otherwise they can hide intermittent failures.
3. Add browser checks for rendered behavior
Browser checks execute JavaScript and load assets. Assert an element that proves the page reached the intended state, such as a search-results container or account heading. Capture a screenshot and browser console output on failure.
import { chromium } from "playwright";

const browser = await chromium.launch({ headless: true });
const page = await browser.newPage();
page.setDefaultTimeout(15000);
const errors = [];
page.on("console", msg => { if (msg.type() === "error") errors.push(msg.text()); });
try {
  await page.goto("https://example.com", { waitUntil: "networkidle" });
  await page.locator("main").waitFor();
  await page.screenshot({ path: "failure-evidence.png", fullPage: true });
  if (errors.length) throw new Error(`console errors: ${errors.join(" | ")}`);
} finally {
  await browser.close();
}
Use explicit waits for a meaningful selector instead of a fixed sleep. A network-idle wait can still be unsuitable for pages with long polling, so combine it with a selector assertion.
4. Script only essential multi-step journeys
Authenticated sign-in, search and checkout tests catch failures that a page-load check cannot. Use a dedicated test account and safe payment or sandbox data. Keep the script deterministic, reset state between runs and handle token or cookie expiry explicitly. Because scripted browsers consume more resources, reserve them for workflows where a failure has a clear business or trust impact.
5. Deploy RUM and compare populations
RUM provides the denominator that synthetic checks lack. Compare page-load times, client-side errors and behavior for browsers, devices and geographies. A sampled RUM stream can show that a problem affects one browser family or one region even when a synthetic check from another location is green.
6. Set alert policy and ownership
Page on repeated failures, not one transient packet loss. Create separate warning and critical thresholds for latency. Suppress alerts during planned maintenance, deduplicate identical incidents and include the URL, location, run identifier, screenshot link and last successful timestamp in the notification.
Recognizing common website failures
- DNS or TLS failure: checks fail before HTTP. Compare locations and inspect DNS records, certificate validity and CDN routing.
- HTTP 5xx: the server or dependency rejected the request. Correlate the timestamp with application logs, traces and deploy events.
- Green status, broken page: a ping passed while JavaScript or an API failed. Add a browser assertion and collect console and network errors.
- Regional slowness: one probe location exceeds the threshold. Use RUM geography data to determine how many customers share the symptom.
- Authentication failure: a journey loops at login or loses its session. Refresh the test credential, verify cookie and token lifetime, and wait for a post-login selector.
- Dependency outage: the page shell loads but search, checkout or payments do not. Assert the dependent result, not only the outer page.
- Client-only regression: a new browser release triggers errors. RUM browser and device breakdowns expose this pattern.
Coverage boundaries you must document
Monitoring only knows what you select. An endpoint check does not cover unlisted routes; a browser journey does not cover every product variation; a check location does not represent every network path. Private applications require a private monitor location or network connectivity. RUM sampling means unsampled sessions are invisible. CloudWatch Internet Monitor reports performance and availability for the traffic included in its monitor, not universal internet health. Record these boundaries beside every service-level objective.
Troubleshooting checklist
| Symptom | Likely cause | Fix |
|---|---|---|
| HTTP check is green but customers report failure | Status and latency do not prove browser functionality | Add rendered-content and JavaScript assertions; inspect RUM errors |
| Only one geography fails | DNS, CDN, routing or regional dependency issue | Compare locations and RUM geography; inspect edge and origin logs |
| Login test flaps | Expired account, race condition or unstable test data | Use a dedicated account, explicit waits and deterministic fixtures |
| Frequent timeout alerts | Threshold ignores DNS, connect, server or render phases | Measure phases separately and set a realistic journey budget |
| Alert storm during a deploy | No maintenance window or deduplication | Suppress planned changes and alert on consecutive failures |
| No RUM impact data | Missing instrumentation or very low sampling | Verify the client snippet, selected percentage and export retention |
| Internal app always fails | Public probe cannot reach private network | Run from a private location with the required DNS and firewall path |
| Canary passes while conversion drops | Journey assertion is too shallow or RUM is missing | Assert the transaction result and inspect sampled sessions |
Performance, reliability and cost practices
- Use lightweight HTTP checks for broad endpoint coverage and frequent intervals.
- Use browser journeys for a small set of revenue and trust paths; they consume more compute and require more maintenance.
- CloudWatch Synthetics can run as often as once per minute, but choose an interval that matches detection targets and alert fatigue.
- Run checks in key customer geographies and during low-traffic periods.
- Set RUM sampling deliberately. Higher sampling improves confidence and volume; lower sampling reduces ingestion and storage.
- Keep screenshots, traces and logs long enough for incident review, and export RUM data if the default 30-day retention is insufficient.
- Review false positives monthly. Tune waits, assertions, retries and thresholds instead of simply muting alerts.
Or skip the browser setup
ScreenshotNeo provides a website screenshot API and MCP server. One GET request returns a PNG, JPEG, WebP or PDF. Before capture it accepts cookie or consent banners and removes more than 60 known consent platforms, newsletter popups and chat widgets; each step can be turned off. Bot checks, blank pages, timeouts, failed loads and cache hits cost nothing, and the response identifies the result with X-Page-Verdict and X-Billed headers. An MCP server exposes take_screenshot, get_page_info and capture_pdf to Claude, Cursor and other MCP clients.
See the ScreenshotNeo API documentation for all options. The basic calls are:
curl -G "https://api.screenshotneo.com/v1/shot" -d access_key=YOUR_API_KEY --data-urlencode url=https://stripe.com -o shot.webpimport requests
r = requests.get("https://api.screenshotneo.com/v1/shot", params={"access_key": "YOUR_API_KEY", "url": "https://stripe.com"}, timeout=90)
open("shot.webp", "wb").write(r.content)const q = new URLSearchParams({ access_key: 'YOUR_API_KEY', url: 'https://stripe.com' });
const res = await fetch(`https://api.screenshotneo.com/v1/shot?${q}`);You can also select an element, capture full pages with lazy images loaded, set a device or viewport, use dark mode and retina scale, wait for selectors or network idle, add custom CSS or JavaScript, block ads and trackers, provide headers, cookies, authorization, timezone or geolocation, resize images, cache with a chosen TTL, create signed links, run asynchronous jobs with signed webhooks, capture up to 100 URLs per bulk call and read usage through an API. Clean shots are the only billable shots. The Free plan includes 1,000 screenshots each month without a card; paid plans start at $5 for 3,000.
Create a free ScreenshotNeo account and get 1,000 screenshots a month with no card.
FAQ
How do I know whether my website is down?
Start with checks from more than one location that assert status and latency. Then run a browser assertion and consult RUM to see whether customers are affected.

Can synthetic monitoring test checkout?
Yes. A scripted browser monitor can sign in, add a safe test item and verify the confirmation state. Use isolated credentials and non-production payment data.
Is RUM a replacement for synthetic checks?
No. RUM observes real sessions and sampled users; synthetic checks run on schedule, including when traffic is low. Their coverage and blind spots differ.
Why did a canary pass while users saw errors?
The canary may use a different geography, browser, account state or path. Compare those dimensions and add assertions for the dependency or transaction that failed.
How often should checks run?
Choose an interval that meets your detection objective and budget. AWS supports CloudWatch canaries as often as once per minute; browser journeys usually need a more selective schedule.