Using Google Maps Traffic Screenshots for Urban Planning and Civil Engineering
Learn what Google Maps traffic screenshots show, how to capture and document them, and when engineering decisions require structured traffic data.
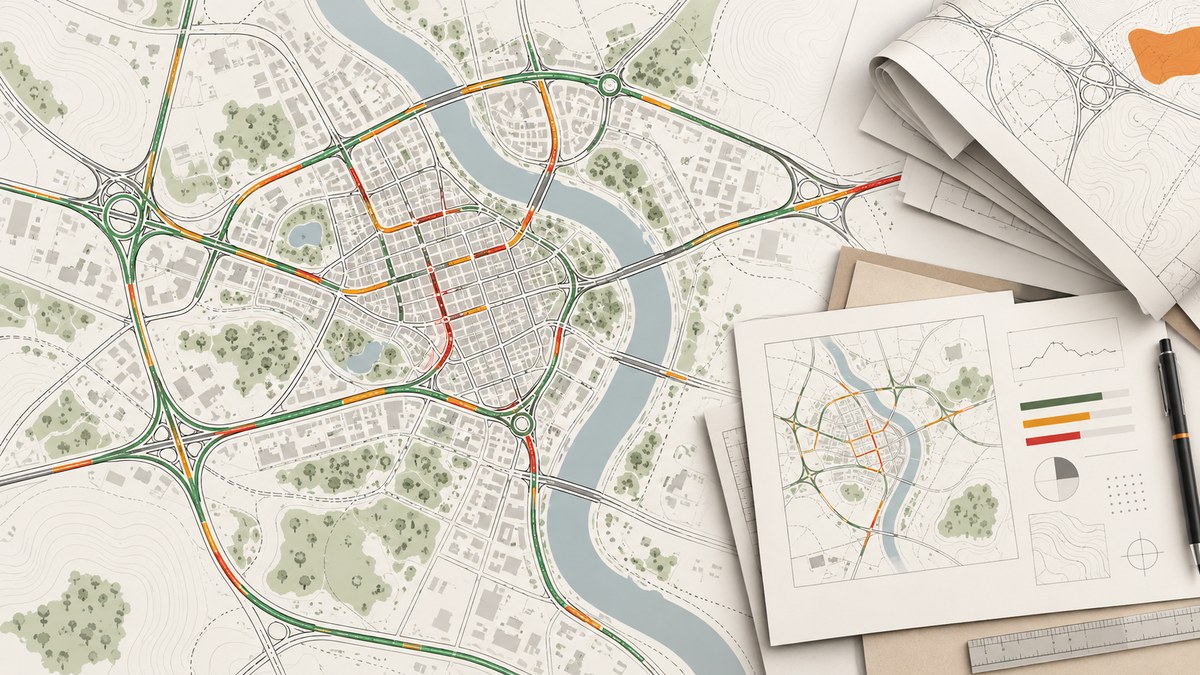
Can Google Maps traffic screenshots be used for urban planning? Yes, as time-stamped visual context. A screenshot shows the traffic condition Google displays on a road network at the moment you captured it. It is not, by itself, a traffic count, a validated speed dataset, a sampling record, or a substitute for a traffic monitoring program.
Use the image to illustrate where congestion was displayed, preserve the capture context, state the limits beside the figure, and corroborate consequential planning or engineering conclusions with structured data that matches the question.
What a Google Maps traffic screenshot actually means
Google’s traffic layer uses colors to communicate displayed traffic conditions. Green indicates no traffic delays, orange indicates a medium amount of traffic, and red indicates traffic delays; darker red indicates slower traffic. Incident symbols can identify crashes, construction, closures, and other disruptions. Google’s help documentation describes the color code as showing the speed of traffic on the road, but the screenshot does not expose the underlying observations, model inputs, confidence, or segment-level record. Google Maps Help explains the traffic layer and legend.
| Visible item | Safe description | Do not infer without other data |
|---|---|---|
| Green, orange, red, or dark red segment | Google displayed no, medium, or delayed traffic at the capture time | Vehicle volume, measured speed, level of service, queue length, or annual average condition |
| Crash, construction, or closure icon | An incident marker was visible in Google Maps | Incident duration, lane blockage, severity, or verified field location |
| Traffic layer over a road network | A visual snapshot of Google’s dynamic traffic display | Continuous monitoring, representative sampling, or a reproducible dataset |
Google says navigation data such as GPS location, route details, and device sensor data may be used alone or with other information for real-time traffic, disruption, weather, and routing features. A static image hides those inputs and does not provide sample size, sensor coverage, processing method, or a way to rerun the same observation. See Google’s explanation of how navigation data makes Maps better.
When screenshots help an urban planning or engineering project
A screenshot is useful when the question is visual and time-specific:

- Where did Google display congestion during a site visit, public meeting, event, or incident?
- Which approaches appeared affected at a particular date and local time?
- How can a report communicate the spatial context of a disruption to a nontechnical audience?
- What locations should be considered for follow-up counts, travel-time runs, or field inspection?
It can support a narrative, an appendix, a before-and-after illustration, or a hypothesis for data collection. It cannot establish how many vehicles crossed a point, what proportion were trucks, the 85th-percentile speed, a design-hour volume, or a typical annual condition.
A defensible capture and documentation workflow
- Define the question. Write one sentence specifying the road area, decision, and time condition you need to illustrate. If the decision needs volumes, speeds, classifications, or weights, plan a structured collection method as well.
- Set the map state. Open Google Maps, choose the traffic layer, set the visible extent and zoom, and wait for the layer and incident markers to finish loading. Keep the legend visible when practical.
- Record context. Save the local date and time with time zone, location or center point, visible map extent, zoom, enabled layers, weather or event context if relevant, and any incident, closure, or construction marker.
- Preserve the original. Keep the unaltered file and its filename or hash in the project record. Make crops and annotations as separate derivatives.
- Caption narrowly. State that the figure represents Google Maps’ displayed traffic conditions at the recorded time. Do not call colors measured speeds or volumes.
- Corroborate decisions. Select counts, speed or travel-time observations, classification, continuous or short-term monitoring, or suitable third-party data according to the decision.
- Check publication rights. Review the current Google Maps and Google Earth additional terms and Geo Guidelines for your report format, audience, redistribution, and attribution requirements. A community answer can point to policy, but it is not controlling permission advice.
DIY capture with a browser (Playwright)
For repeatable internal documentation, a browser script can open a map URL, wait for the map to render, and save a viewport image. Google Maps is a dynamic application, so selectors and load timing can change. Use this approach for your own capture workflow and review every output.
import { chromium } from 'playwright';

const url = process.env.MAPS_URL || 'https://www.google.com/maps/@40.741,-73.989,13z/data=!5m1!1e1';
const browser = await chromium.launch({ headless: true });
const context = await browser.newContext({
  viewport: { width: 1600, height: 1000 },
  deviceScaleFactor: 1
});
const page = await context.newPage();
await page.goto(url, { waitUntil: 'domcontentloaded', timeout: 60000 });
await page.waitForTimeout(8000); // allow traffic tiles and markers to appear
await page.screenshot({ path: 'traffic-map.png', fullPage: false });
await browser.close();
Install with npm install playwright and download a browser with npx playwright install chromium. Use a fixed viewport and timezone when comparing captures. Save the URL, timestamp, and script version beside each image. Do not automate around sign-in, CAPTCHA, access controls, or rate limits.
Useful browser settings
- Viewport: Choose dimensions that fit the report figure and keep the legend readable.
- Device scale factor: A value of 2 can improve text and line sharpness but increases image size.
- Wait strategy: Combine DOM readiness with a short delay; network idle alone may never occur on a map application.
- Full page: Usually unsuitable for a map because it captures surrounding page chrome rather than a consistent geographic extent.
- Repeatability: Keep center, zoom, viewport, timezone, and capture time documented. Traffic itself changes continuously.
Or skip the browser setup
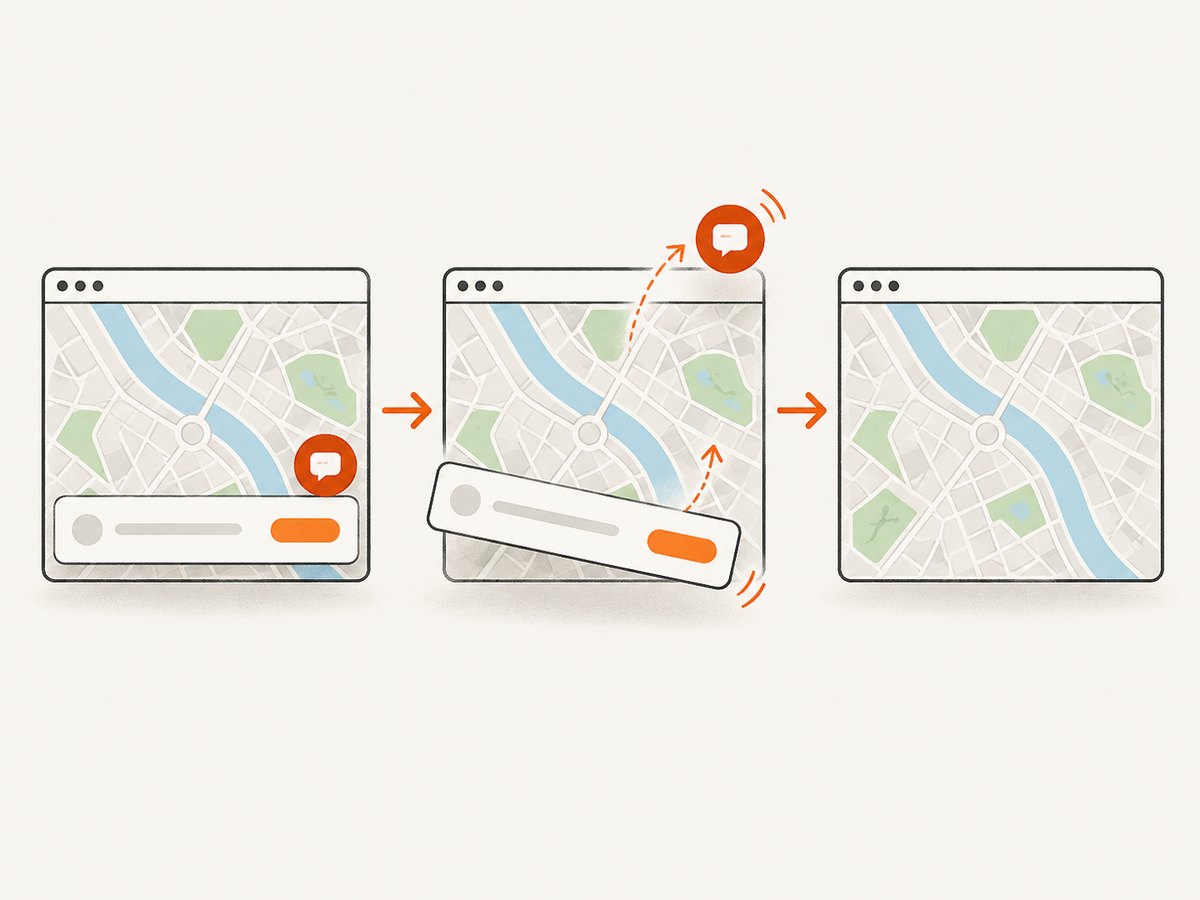
ScreenshotNeo provides a website screenshot API and MCP server. One GET request returns PNG, JPEG, WebP, or PDF. Before capture it can accept consent banners and remove more than 60 known consent platforms, newsletter popups, and chat widgets; each step can be turned off. Only clean shots are billed. Bot checks, CAPTCHAs, blank pages, timeouts, failed loads, and cache hits cost nothing, and the response reports the result with X-Page-Verdict and X-Billed headers.
For a public map URL or an internal page that renders a traffic view, start with the basic call. See the ScreenshotNeo API documentation for all options.
curl -G "https://api.screenshotneo.com/v1/shot" -d access_key=YOUR_API_KEY --data-urlencode url=https://stripe.com -o shot.webpimport requests
r = requests.get("https://api.screenshotneo.com/v1/shot", params={"access_key": "YOUR_API_KEY", "url": "https://stripe.com"}, timeout=90)
open("shot.webp", "wb").write(r.content)const q = new URLSearchParams({ access_key: 'YOUR_API_KEY', url: 'https://stripe.com' });
const res = await fetch(`https://api.screenshotneo.com/v1/shot?${q}`);Relevant options for a planning capture include full-page mode with lazy images loaded, a CSS element capture, dark mode, 12 device presets or a custom viewport, retina scale, PDF paper size and margins, custom CSS and JavaScript, click actions, selector waits, delay or network-idle waits, blocked ads or trackers, custom headers, cookies, user agent and Authorization, timezone and geolocation, transparent backgrounds, resizing, a chosen cache TTL, signed links for public <img> tags, asynchronous jobs with signed webhooks, bulk capture of up to 100 URLs per call, and the usage API. Parameter names used by other screenshot APIs also work, which can simplify migration.
ScreenshotNeo also includes an MCP server with take_screenshot, get_page_info, and capture_pdf tools for Claude, Cursor, and other MCP clients. An agent can inspect a page, capture the relevant view, and produce a PDF without you maintaining browser infrastructure.
How to write the figure caption and methods note
A useful caption includes:
Google Maps traffic layer showing displayed traffic conditions around [area], captured [YYYY-MM-DD HH:MM] [time zone]. Green, orange, and red indicate Google's displayed traffic categories; the image is a time-specific visual snapshot and is not a traffic count or speed survey.In the methods section, identify the URL or map location, traffic layer, viewport or extent, capture tool, local time and timezone, and any crop or annotation. Explain why the image is included and which independent dataset supports the related conclusion.
Match the evidence to the engineering question
The Federal Highway Administration’s Traffic Monitoring Guide (2022) describes volume, classification, speed, and weight programs that support planning, design, operations, safety, environmental analysis, finance, and performance management. It also discusses continuous and short-term programs, collection technologies, natural traffic variation, and limitations caused by monitoring design and duration.
| Question | Better evidence | Role for a screenshot |
|---|---|---|
| How many vehicles use the road? | Automatic or manual counts with documented locations and periods | Illustrate the location or event context |
| How fast do vehicles travel? | Validated spot-speed or travel-time measurements | Show where Google displayed delay |
| What is the typical or annual condition? | Continuous or representative short-term monitoring with seasonal treatment | Provide a dated example, never the annual estimate |
| What share are trucks or buses? | Vehicle classification data | Map the corridor for readers |
| Can a third-party feed be published? | Review accuracy, ownership, cost, and rights to use, share, and release | Supplement the documented analysis |
Edge cases and limitations
- Changing conditions: Two captures minutes apart can differ. Treat each as its own observation.
- Map scale: At a wide extent, colors may be hard to assign to a particular segment. Capture a second close view when location matters.
- Incidents: A marker may be reported, delayed, or already cleared. Record it as displayed and verify consequential facts independently.
- Missing or stale tiles: A blank or partially colored map is not evidence of free flow. Recapture after the layer loads and record the problem.
- Access and localization: Region, language, timezone, account state, and browser settings can affect what is displayed.
- Reproduction: A screenshot cannot recreate Google’s underlying navigation-data inputs. Preserve the original file and metadata.
- Privacy: Crop unrelated personal information, account details, or locations that should not enter the public report.
Troubleshooting
| Symptom | Likely cause | Fix |
|---|---|---|
| Traffic colors are absent | Traffic layer is off, tiles have not loaded, or the view has no available condition | Enable the layer, wait, zoom to the target roads, and capture again. Record that no colors were displayed. |
| Playwright times out | Dynamic map requests continue or the network is slow | Use domcontentloaded plus a bounded delay, raise the timeout, and retain a failed-run log. |
| Screenshot is cropped incorrectly | Browser viewport differs from the intended report frame | Set explicit width, height, scale factor, center, and zoom; inspect one output before batching. |
| Consent or chat UI covers the map | A banner or widget appeared after navigation | Dismiss it in the browser flow, hide the selector, or use ScreenshotNeo’s consent and widget removal options. |
| ScreenshotNeo response is not an image | Invalid key, inaccessible URL, failed load, or a page verdict indicating a bot check | Inspect the HTTP status and X-Page-Verdict/X-Billed headers, then fix authentication or target accessibility before retrying. |
| Repeated captures consume unexpected time | Each request waits for dynamic resources or bypasses cache | Use a selector or fixed delay, choose an appropriate cache TTL, and use bulk or asynchronous jobs for larger sets. |
Performance, reliability, and cost
Browser automation has a setup cost: Chromium downloads, concurrent workers, memory, patching, and handling dynamic pages. Limit concurrency, reuse a browser context where safe, set explicit timeouts, and retain failed artifacts for review. A screenshot is evidence only when the capture process and metadata are auditable.
ScreenshotNeo’s cache can reduce repeat work when the chosen TTL matches your evidence needs. For many locations, bulk capture supports up to 100 URLs per call; asynchronous jobs and signed webhooks keep long batches out of a request timeout. Use the usage API to reconcile project consumption. Only clean shots are billed, while cache hits and failed or blank results are not billed.
Plans are Free: 1,000 shots per month with no card; Starter: $5 for 3,000; Growth: $15 for 15,000; Pro: $39 for 60,000; Scale: $99 for 250,000; and Business: $249 for 1,000,000. Yearly billing gives two months free, and every feature is on every plan.
Short checklist before publication
- Capture date, local time, timezone, extent, layer, and tool are recorded.
- The original image is preserved separately from crops and annotations.
- The caption says “Google Maps displayed traffic conditions.”
- No color is described as a count, measured speed, or annual condition without supporting data.
- Engineering conclusions cite fit-for-purpose monitoring or third-party data.
- Current Google licensing terms and Geo Guidelines have been checked.
- Any ScreenshotNeo request logs verdict and billing headers.
FAQ
Is a red road a measured queue length?
No. It is Google’s displayed delayed-traffic category. Queue length requires field or sensor measurements.
Can one screenshot prove a dangerous intersection?
No. It can show that delay was displayed at one time. Safety claims need crash, conflict, speed, geometry, or other appropriate evidence.
Should I include the legend?
Yes when space allows. It helps readers interpret the colors and reduces the chance that they mistake them for engineering measurements.
Can I schedule recurring captures?
Yes, with a controlled browser job or ScreenshotNeo’s API and asynchronous workflow. Store each image with its timestamp and request parameters.
Where can an AI agent capture these images?
ScreenshotNeo’s MCP server exposes take_screenshot, get_page_info, and capture_pdf to MCP clients such as Claude and Cursor.
Or skip the browser setup
With ScreenshotNeo, cookie banners, popups, and chat widgets are removed before the shot; bot checks, blank pages, and failed loads are never billed; and the MCP server lets AI agents take screenshots. You get 1,000 screenshots a month free with no card, and paid plans start at $5 for 3,000. Create a free ScreenshotNeo account.