How to Improve Node.js Performance
A measurement-first guide to finding Node.js bottlenecks, profiling CPU and memory, benchmarking safely, and validating each optimization.
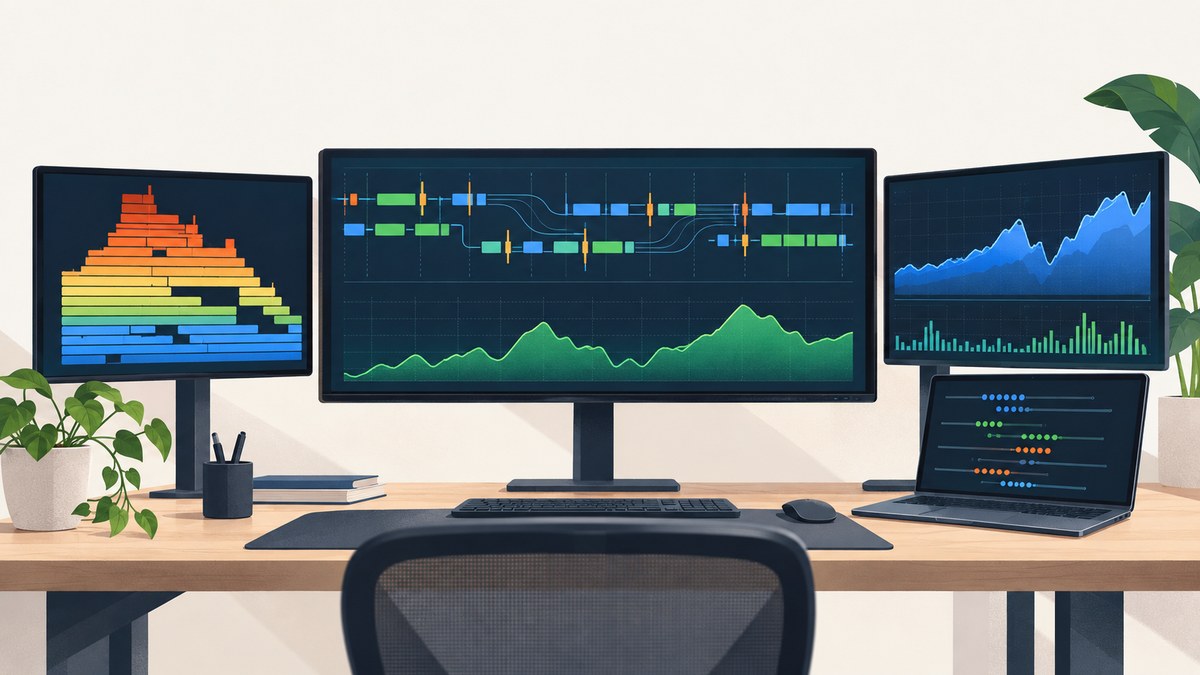
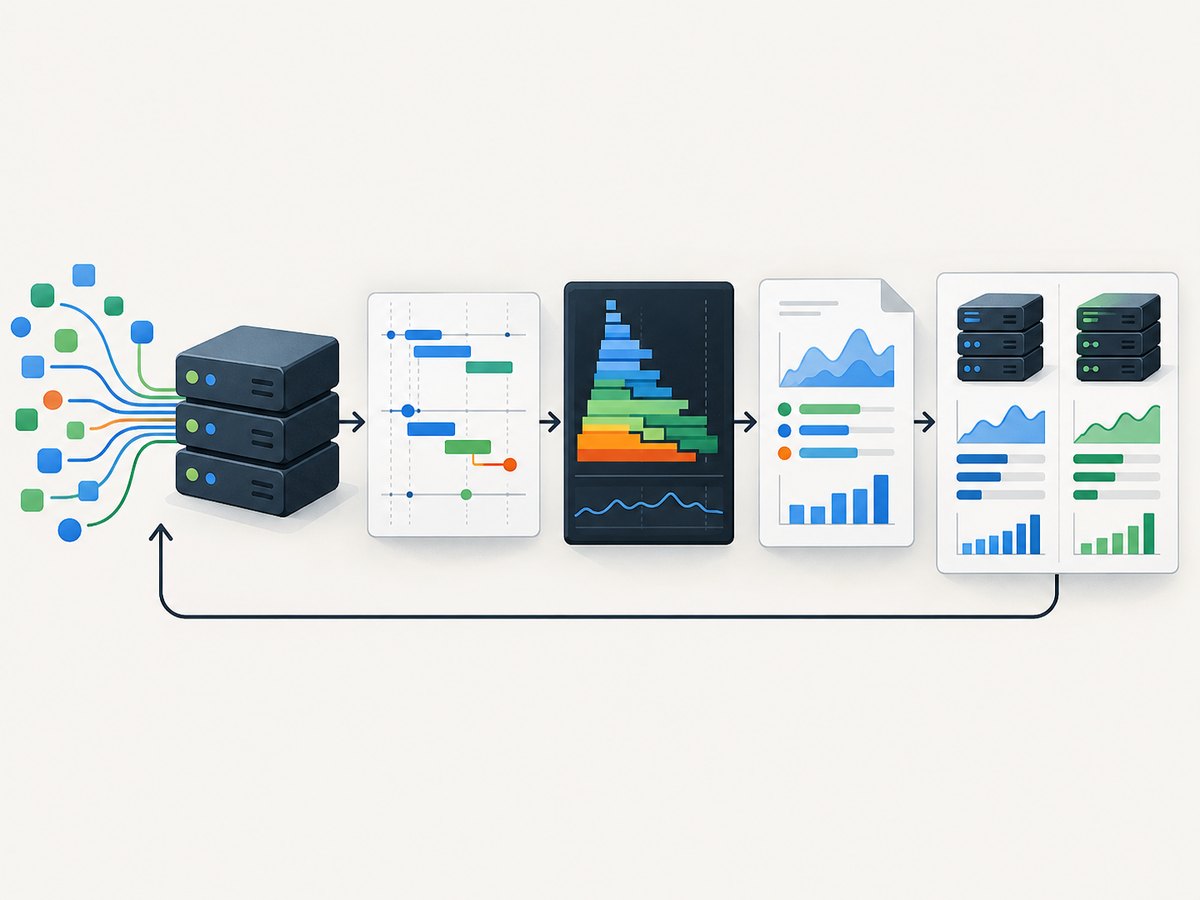
Start by measuring the real workload. Node.js performance work is most reliable when you define the symptom, capture a baseline, identify the bottleneck with the right diagnostic tool, change one thing, and repeat the same measurement. There is no source-level optimization that improves every Node.js program. Request latency, throughput, CPU, memory, and startup time require different evidence.
This guide shows a repeatable workflow using Node.js built-ins. It includes runnable timing, CPU profiling, diagnostic reports, tracing, benchmark design, production checks, and a practical troubleshooting checklist. The examples target current Node.js documentation, so verify API details against the release you deploy.
1. Define the symptom and a representative workload
Write down what “slow” means before changing code:
- Latency: requests or jobs take too long, especially at a percentile such as p95 or p99.
- Throughput: the process completes too few requests, messages, or records per second.
- CPU: one or more cores stay busy, or event-loop work delays callbacks.
- Memory: resident memory grows, garbage collection becomes frequent, or the process approaches its limit.
- Startup: loading modules, compiling code, or warming caches takes too long.
Use a workload that resembles production: the same input sizes, concurrency, database behavior, network dependencies, feature flags, and Node.js version. A tiny synthetic loop can hide serialization, I/O, garbage collection, or parsing costs that dominate the real service.
2. Establish a baseline with node:perf_hooks
Node’s performance APIs provide high-resolution timing, the performance timeline, user timing, and resource timing. Put marks around meaningful operations, then record the raw duration and workload parameters. See the performance measurement documentation for the release-specific API.
import { performance, PerformanceObserver } from 'node:perf_hooks';

const observer = new PerformanceObserver((list) => {
  for (const entry of list.getEntries()) {
    console.log(JSON.stringify({
      name: entry.name,
      duration_ms: entry.duration
    }));
  }
});
observer.observe({ entryTypes: ['measure'] });

async function parseAndTransform(input) {
  performance.mark('work-start');
  const parsed = JSON.parse(input);
  const result = parsed.items
    .filter(item => item.enabled)
    .map(item => ({ id: item.id, value: item.value * 2 }));
  performance.mark('work-end');
  performance.measure('parse-and-transform', 'work-start', 'work-end');
  return result;
}

const input = JSON.stringify({
  items: Array.from({ length: 10000 }, (_, id) => ({
    id,
    enabled: id % 2 === 0,
    value: id
  }))
});

await parseAndTransform(input);
Keep the measurement boundary stable between runs. Include enough operations to make timer overhead small, but do not let the test become unrelated to production. Store the Node.js version, CPU or container limits, input size, concurrency, warm-up behavior, and every raw sample.
3. Find JavaScript CPU hotspots with the Inspector profiler
Timing tells you that an operation is slow; a CPU profile helps show where JavaScript execution time is spent. The official Inspector documentation demonstrates starting and stopping a profile programmatically. Save profiles from a controlled reproduction and inspect the hot functions before editing code.
import fs from 'node:fs';
import inspector from 'node:inspector';

const session = new inspector.Session();
session.connect();

const post = (method, params = {}) => new Promise((resolve, reject) => {
  session.post(method, params, (error, result) =>
    error ? reject(error) : resolve(result));
});

await post('Profiler.enable');
await post('Profiler.start');

// Run the representative workload here.
for (let i = 0; i < 500; i++) {
  JSON.stringify(Array.from({ length: 1000 }, (_, n) => n * i));
}

const { profile } = await post('Profiler.stop');
fs.writeFileSync('cpu-profile.cpuprofile', JSON.stringify(profile));
session.disconnect();
console.log('Wrote cpu-profile.cpuprofile');
Use a profile as evidence, not as a fix. Look for repeated parsing, serialization, regular-expression work, accidental quadratic loops, synchronous filesystem calls, and expensive transformations on the request path. Confirm that the profile represents the slow workload rather than profiler startup or an idle process.
Node’s command-line CPU profiling flags are documented as stable in recent releases, including Node v22.4.0 and v20.16.0. Check the all-APIs documentation for the exact flags supported by your deployed version before adding them to a service command.
4. Broaden the investigation with diagnostic reports
A CPU profile focuses on JavaScript execution. A diagnostic report preserves wider runtime and platform context: JavaScript and native stacks, V8 heap information, libuv handles, CPU and memory usage, and system limits. This is useful when symptoms involve native modules, file descriptors, memory pressure, or a process that is stuck outside ordinary JavaScript. See Node.js diagnostic reports.
import process from 'node:process';

const file = process.report.writeReport('./diagnostic-report.json');
console.log(`Wrote ${file}`);
Generate a report close to the failure or high-resource period, while recording the workload and deployment limits. Treat reports as sensitive operational data: they can include paths, environment details, and stack information. Store them with the same access controls as logs.
5. Use trace events when you need a timeline
Trace events can combine information from V8, Node.js core, and user code, including performance API measurements. The documented trace-events module is experimental, so check compatibility and output behavior before making it part of a routine production workflow. A trace is helpful when you need to understand ordering, pauses, or interactions across subsystems rather than one hot function.
import traceEvents from 'node:trace_events';

const tracing = traceEvents.createTracing({
  categories: ['node.perf', 'v8']
});
tracing.enable();

// Exercise the representative request or job here.
await new Promise(resolve => setTimeout(resolve, 100));

tracing.disable();
console.log('Trace collection stopped');
Trace output can be opened in Chrome’s tracing interface. Keep captures short and focused because broad tracing can create large files and alter timing.
6. Benchmark a change without fooling yourself
Node’s benchmark documentation calls out several sources of noise: JIT compilation, garbage collection, CPU frequency changes, and system load. Preserve raw samples and investigate noisy or skewed distributions. Warm the process, amortize timer and harness overhead, and make the result observable so an optimizing runtime cannot remove the measured work.
The official benchmark guidance includes a useful warning: A statistically consistent result does not prove that a benchmark measured the intended work.
Validate surprising results with an independent workload shape. Keep the Node.js version, machine or container limits, input data, concurrency, and measurement boundaries fixed. Compare compatible runs rather than treating one mean as a universal speed score.
import { performance } from 'node:perf_hooks';

function transform(values) {
  let checksum = 0;
  for (const value of values) checksum += value * 2;
  return checksum;
}

const values = Array.from({ length: 100000 }, (_, i) => i);
for (let i = 0; i < 10; i++) transform(values); // warm-up

const samples = [];
for (let i = 0; i < 20; i++) {
  const start = performance.now();
  const result = transform(values);
  const duration = performance.now() - start;
  samples.push({ duration_ms: duration, result }); // observable work
}
console.log(JSON.stringify(samples, null, 2));
node:bench is documented for Node v26.10.0 behind --experimental-bench and marked Stability 1.0, Early Development. It does not force a particular optimization state or decide whether your benchmark measured the intended work. Check the target runtime’s benchmark documentation before depending on it.
7. Apply changes that match the evidence
- CPU hotspot: reduce repeated parsing or serialization, avoid accidental nested scans, and move expensive work off the request path when the product allows it. Re-profile after each change.
- Event-loop delay: locate synchronous filesystem, compression, cryptography, or large JSON operations. Measure the complete callback or request path, not just one function.
- Memory growth: use diagnostic reports and heap-related evidence to find retained objects, unbounded caches, or queues that outpace consumers. Reproduce with a long enough run to distinguish warm-up allocation from a leak.
- Startup cost: measure module loading and initialization separately from steady-state requests. Avoid optimizing startup based on a benchmark that only measures warmed code.
- I/O wait: inspect dependency timing, pool limits, retries, payload size, and concurrency. A faster JavaScript loop cannot remove time spent waiting on a database or remote service.
Change one likely cause at a time. Record the code revision, configuration, raw samples, and workload so a regression can be explained later.
8. Reliability, production safety, and cost considerations
Profiling and tracing add overhead and can change scheduling. Capture them in a staging environment first, or for a short, controlled production window when the operational need justifies it. Diagnostic files and profiles may contain sensitive data. Rotate and restrict access, and remove them according to your retention policy.
Performance work also has an engineering cost. A micro-optimization that saves a small amount of CPU but makes code harder to maintain may not be worthwhile. Prefer changes supported by repeated measurements on representative inputs. Keep a rollback path and compare error rate, latency, throughput, and resource use together; improving one metric can worsen another.
9. Troubleshooting checklist
| Symptom | Likely cause | Fix |
|---|---|---|
| Every run has a different duration | JIT warm-up, garbage collection, CPU frequency, or background load | Warm up, isolate the machine or container, collect more raw samples, and inspect the distribution. |
| Profile shows mostly idle time | The captured process was waiting on I/O or the workload ended before profiling | Profile a sustained representative workload and measure dependency timing separately. |
| Optimization looks unrealistically large | The benchmark eliminated unused work or specialized to an overly narrow input | Make outputs observable and validate with a second workload shape. |
| Memory rises during a short test | Warm-up allocation, caches, or delayed garbage collection | Run longer, force comparable workload cycles, and use reports or heap evidence before calling it a leak. |
| Trace files are huge | Too many categories or an unbounded capture | Enable only needed categories and stop tracing quickly. |
| Inspector profiling fails in production | Inspector access or runtime flags are restricted | Capture in a controlled reproduction, verify the Node.js version, and use a diagnostic report for broader context. |
node:bench is unavailable |
The deployed release does not include the early-development runner | Use node:perf_hooks with a small harness, or follow the matching release documentation. |
10. Or skip the browser setup: capture performance evidence with ScreenshotNeo
If your performance investigation includes visual checks of pages, reports, or dashboards, ScreenshotNeo provides a website screenshot API and MCP server at screenshotneo.com. A single GET request returns PNG, JPEG, WebP, or PDF. The API accepts full-page captures with lazy images, CSS-selector element captures, dark mode, device presets or custom viewports, retina scale, custom CSS and JavaScript, waits, blocked resources, headers, cookies, user agents, authorization, timezone, geolocation, transparent backgrounds, resizing, caching, signed links, asynchronous jobs, bulk capture, usage data, and an OpenAPI specification. Parameter names used by other screenshot APIs also work, which can simplify a switch.
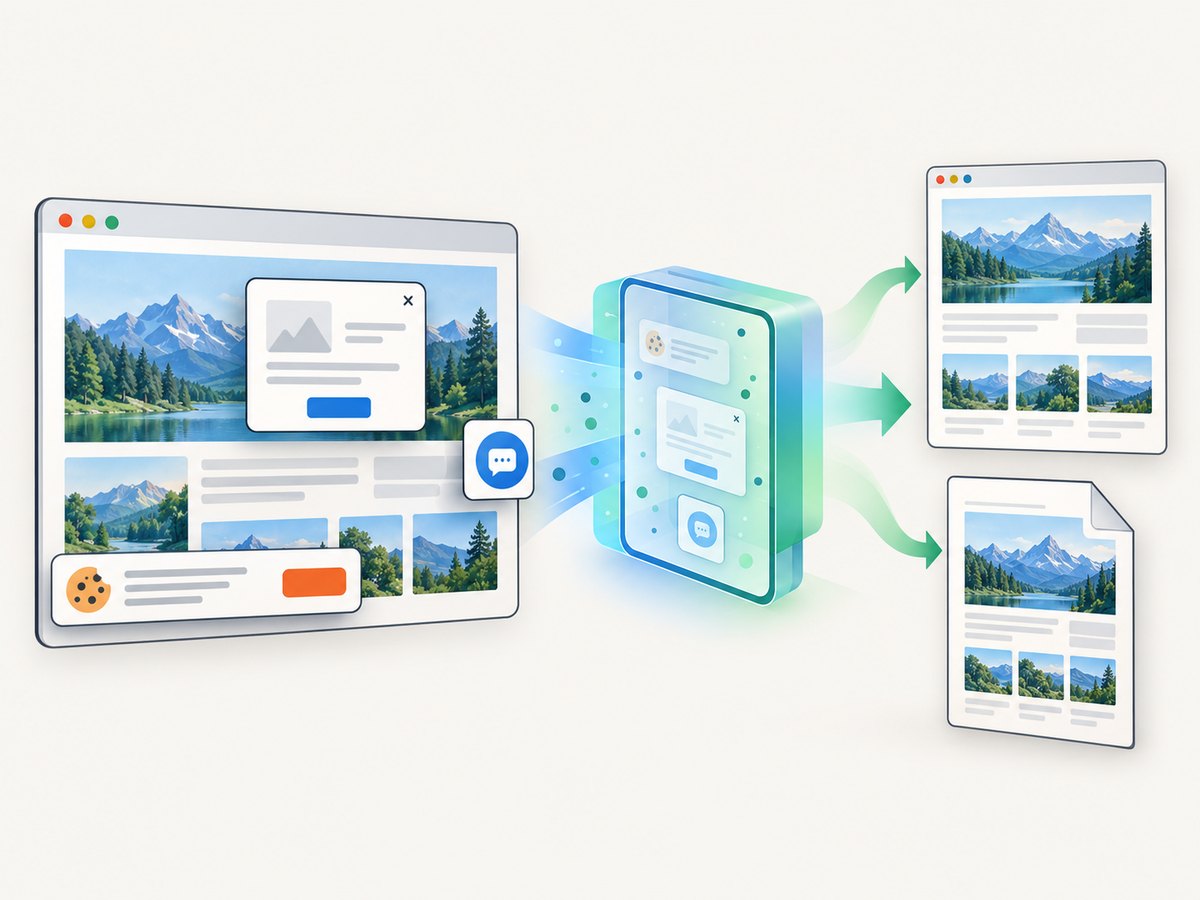
Before capture, it accepts cookie or consent banners and removes more than 60 known consent platforms, newsletter popups, and chat widgets; each step can be disabled. Only clean shots are billed. Bot checks or CAPTCHAs, blank pages, timeouts, failed loads, and cache hits cost nothing, and response headers report the page verdict and billing state.
cURL (see the ScreenshotNeo API documentation):
curl -G "https://api.screenshotneo.com/v1/shot" -d access_key=YOUR_API_KEY --data-urlencode url=https://stripe.com -o shot.webpPython:
import requests
r = requests.get("https://api.screenshotneo.com/v1/shot", params={"access_key": "YOUR_API_KEY", "url": "https://stripe.com"}, timeout=90)
open("shot.webp", "wb").write(r.content)Node.js:
const q = new URLSearchParams({ access_key: 'YOUR_API_KEY', url: 'https://stripe.com' });
const res = await fetch(`https://api.screenshotneo.com/v1/shot?${q}`);
if (!res.ok) throw new Error(`Screenshot failed: ${res.status}`);
const image = Buffer.from(await res.arrayBuffer());
require('node:fs').writeFileSync('shot.webp', image);
An MCP server exposes take_screenshot, get_page_info, and capture_pdf to Claude, Cursor, and other MCP clients. Plans include 1,000 screenshots per month free with no card; paid plans start at $5 for 3,000 shots, and every feature is available on every plan. Create a free ScreenshotNeo account to try it.
11. Frequently asked questions
Should I optimize CPU, memory, or latency first?
Start with the symptom that affects users or capacity. Measure that symptom, then inspect supporting signals such as CPU and memory to identify its cause.
Is a CPU profile enough to diagnose a slow API?
No. A profile explains JavaScript CPU time. If the request waits on a database, filesystem, network, native module, or resource limit, add timing and a diagnostic report.
How many benchmark samples should I collect?
There is no universal count. Collect enough to see warm-up, garbage-collection, and scheduling variation, preserve every sample, and investigate skew rather than relying on one average.
Can I compare results from different Node.js versions?
You can, but treat the runtime version as an experimental variable. Keep hardware, workload, configuration, and measurement boundaries comparable, and report the versions with the results.
When should I use tracing instead of profiling?
Use profiling to find CPU hotspots. Use tracing when ordering, pauses, or cross-subsystem interactions over time are the question, and remember that Node’s trace-events module is experimental.


