How to Use Playwright for Performance Testing
Measure real browser journeys with Playwright, choose reliable readiness boundaries, diagnose slow steps with traces, and know when to use load testing.
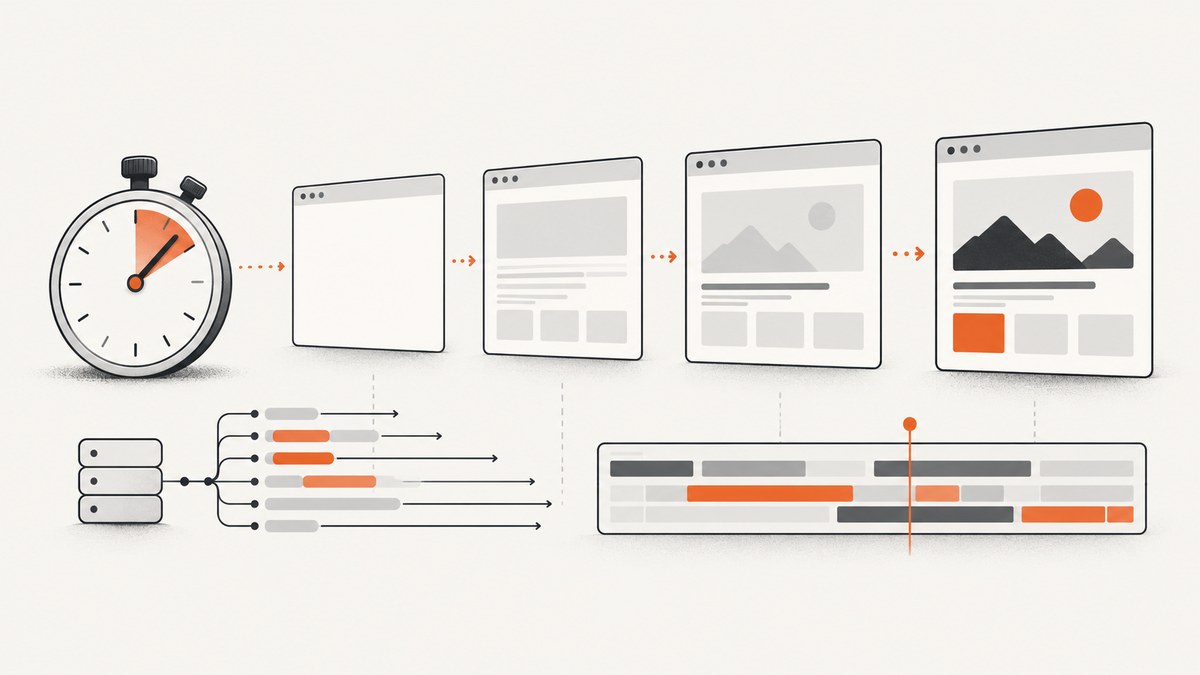
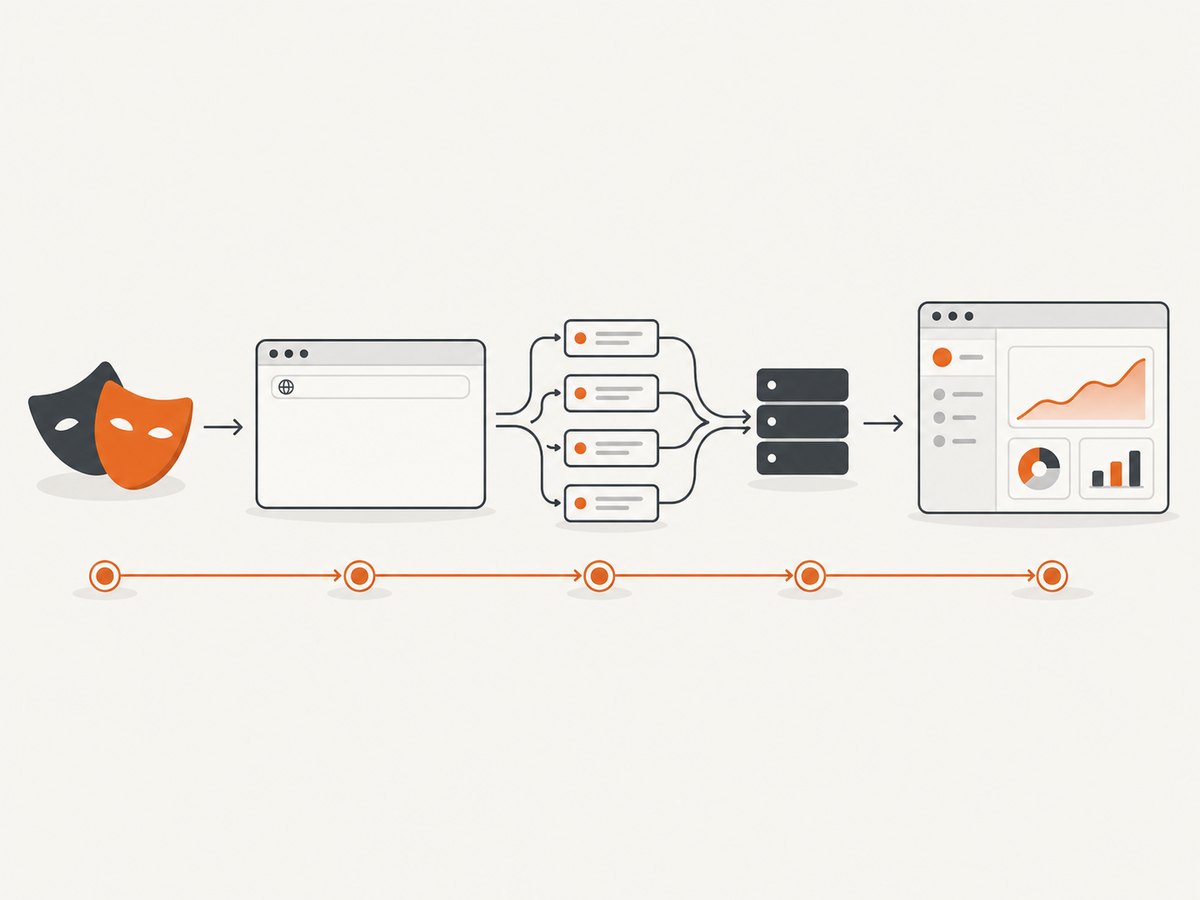
Use Playwright to measure browser-observed user journeys, not to replace a high-concurrency load generator. Define a start event and a user-visible readiness condition, measure repeated runs in controlled browser projects, and use network logs and traces to explain slow steps. For sustained concurrency, throughput, saturation, and capacity limits, pair Playwright with a dedicated load-testing or observability system.
Playwright provides browser automation, assertions, parallel test execution, network controls, emulation, and tracing. Its documentation describes it as a framework for reliable web automation and testing, while its APIs expose the evidence needed to understand what a user experienced. Sources: Playwright homepage, writing tests.
1. Define the performance question first
A useful result starts with a precise question. Write these fields before creating a test:
| Field | Example |
|---|---|
| Journey | Landing page, search, checkout, or authenticated dashboard |
| Start | Navigation request issued, or a user action such as submitting search |
| Readiness boundary | Product table is visible and the first row contains data |
| Browser and device | Chromium desktop, or a configured mobile device profile |
| Network assumptions | Local wired runner, throttled connection, or a representative CI environment |
| Pass/fail rule | Your service-level objective for the journey and its percentile |
Do not use one generic page-load number as the whole user experience. A page can reach load while its main control is still unusable, or remain busy because analytics and chat connections never stop. Measure the boundary that represents the outcome users need.
2. Install Playwright and create an isolated test
npm init playwright@latestChoose JavaScript or TypeScript, install the browsers, and keep the journey in a dedicated test. Playwright Test gives each test an isolated environment and auto-waits for actionability, which improves repeatability. A minimal JavaScript test:
import { test, expect } from '@playwright/test';

test('dashboard reaches interactive readiness', async ({ page }) => {
  const started = performance.now();
  await page.goto('https://example.com/dashboard', { waitUntil: 'domcontentloaded' });
  await expect(page.getByRole('heading', { name: 'Dashboard' })).toBeVisible();
  await expect(page.getByRole('table')).toBeVisible();
  console.log(`ready_ms=${(performance.now() - started).toFixed(0)}`);
});
Run it with:
npx playwright test tests/dashboard.spec.js --project=chromiumKeep setup, authentication, test data, and cleanup deterministic. Reuse a known account or storage state when authentication itself is not the subject of the measurement.
3. Choose navigation timing boundaries deliberately
page.goto() supports commit, domcontentloaded, load, and networkidle. The Page API defines networkidle as no network connections for at least 500 ms and marks it discouraged for testing; a web assertion tied to user-visible behavior is usually a better finish condition. See the Page API.
import { test, expect } from '@playwright/test';

test('compare browser milestones with readiness', async ({ page }) => {
  const t0 = performance.now();
  await page.goto('https://example.com/shop', { waitUntil: 'commit' });
  const committed = performance.now() - t0;

  await page.waitForLoadState('domcontentloaded');
  const domContentLoaded = performance.now() - t0;

  await page.waitForLoadState('load');
  const load = performance.now() - t0;

  await expect(page.getByRole('heading', { name: 'Shop' })).toBeVisible();
  await expect(page.getByTestId('product-grid')).toBeVisible();
  const ready = performance.now() - t0;

  console.log({ committed, domContentLoaded, load, ready });
});
Use waitForSelector or a locator assertion only when the selector expresses readiness. A fixed delay can be useful for a known animation, but it is not evidence that the application is ready.
4. Measure complete user journeys
Measure each important step separately so a slow search, checkout, or dashboard request is visible in the result.
import { test, expect } from '@playwright/test';

test('search journey timing', async ({ page }) => {
  await page.goto('https://example.com', { waitUntil: 'domcontentloaded' });
  await expect(page.getByRole('textbox', { name: 'Search' })).toBeVisible();

  const searchStart = performance.now();
  await page.getByRole('textbox', { name: 'Search' }).fill('laptop');
  await page.getByRole('button', { name: 'Search' }).click();
  await expect(page.getByTestId('search-results')).toBeVisible();
  const searchReady = performance.now() - searchStart;

  const firstResult = page.getByTestId('search-result').first();
  await expect(firstResult).toBeVisible();
  console.log({ search_ready_ms: Math.round(searchReady) });
});
For authenticated journeys, load a saved state or perform login in a setup project. For checkout and mutation flows, use isolated test data and clean up after each run so data contention does not become a hidden variable.
5. Repeat runs across browsers and devices
Run the same journey as configured projects. Playwright can run Chromium, Firefox, and WebKit, and device emulation can set viewport, user agent, touch, locale, timezone, permissions, and other conditions. Sources: running tests and emulation.
// playwright.config.js
import { defineConfig, devices } from '@playwright/test';

export default defineConfig({
  testDir: './tests',
  retries: 1,
  projects: [
    { name: 'chromium-desktop', use: { ...devices['Desktop Chrome'] } },
    { name: 'firefox-desktop', use: { ...devices['Desktop Firefox'] } },
    { name: 'webkit-desktop', use: { ...devices['Desktop Safari'] } },
    { name: 'mobile-chrome', use: { ...devices['Pixel 7'] } }
  ],
  reporter: [['list'], ['json', { outputFile: 'results.json' }]]
});
Compare like-for-like runs: same build, data shape, geographic region, browser version, viewport, and network assumptions. Collect enough repeated samples to see median and tail behavior. Playwright’s documentation does not prescribe a universal sample count or threshold; set those from your own service-level objectives.
6. Add network evidence
Listen to requests and responses to connect a slow visible step with backend behavior, response size, retries, or a third-party dependency. Playwright can monitor and modify HTTP and HTTPS traffic, including XHR and fetch. See the network guide.
import { test, expect } from '@playwright/test';

test('record API timing for search', async ({ page }) => {
  const apiTimings = [];
  page.on('response', async response => {
    if (response.url().includes('/api/search')) {
      const request = response.request();
      apiTimings.push({
        url: response.url(),
        status: response.status(),
        resourceType: request.resourceType()
      });
    }
  });

  await page.goto('https://example.com', { waitUntil: 'domcontentloaded' });
  await page.getByRole('textbox', { name: 'Search' }).fill('laptop');
  await page.getByRole('button', { name: 'Search' }).click();
  await expect(page.getByTestId('search-results')).toBeVisible();
  console.log(apiTimings);
});
Keep mocked runs separate from measurements intended to represent production traffic. Route interception is excellent for isolating a frontend or simulating failures, but mocked responses do not measure the real service.
7. Use traces to diagnose slow steps
Trace Viewer is a GUI for exploring recorded Playwright traces after a run. A trace can show action durations, DOM snapshots, screenshots, console messages, and network logs. Configure traces for retries or failures rather than every test: the best-practices guide warns that recording every trace is performance heavy. Sources: Trace Viewer and best practices.
// playwright.config.js
import { defineConfig } from '@playwright/test';

export default defineConfig({
  use: {
    trace: 'on-first-retry',
    screenshot: 'only-on-failure',
    video: 'retain-on-failure'
  }
});
npx playwright show-trace test-results/**/trace.zipFor a focused diagnostic, use the lower-level tracing API:
import { chromium } from 'playwright';

const browser = await chromium.launch();
const context = await browser.newContext();
await context.tracing.start({ screenshots: true, snapshots: true });
const page = await context.newPage();
await page.goto('https://example.com', { waitUntil: 'domcontentloaded' });
await page.getByRole('heading').first().waitFor();
await context.tracing.stop({ path: 'trace.zip' });
await browser.close();
context.tracing records browser operations and network activity but not expect assertions. Playwright Test tracing includes assertions. For Chromium-only deep diagnostics, browser.startTracing() and browser.stopTracing() produce a file for Chrome DevTools’ Performance panel. See the Tracing API and Browser API.
8. Export repeatable results
Store raw samples with commit SHA, browser project, device, region, and test data version. Report median and tail percentiles for each readiness boundary, plus error rate. A simple JSON reporter is configured above; CI can archive results.json and traces for failed or regressed runs.
npx playwright test --project=chromium --reporter=json > playwright-results.jsonInvestigate regressions with the corresponding trace and network evidence. Do not compare a traced run with an untraced run as if instrumentation had no cost.
9. Know when Playwright is the wrong load tool
| Question | Playwright | Dedicated load platform |
|---|---|---|
| Primary answer | Does a real browser journey become ready? | What throughput, saturation, and capacity can the service sustain? |
| Execution cost | A browser per worker | Lightweight protocol-level virtual users |
| Evidence | DOM assertions, action timeline, screenshots, console, network logs | Aggregate latency, error rate, throughput, and resource saturation |
| Environment | Browser engine and device emulation | Distributed load-injector topology |
| Scale boundary | A few realistic journeys | Sustained high concurrency |
This boundary is a scope recommendation inferred from Playwright’s browser automation and tracing APIs. Playwright can run tests in parallel, but browser journeys still answer an end-user-path question. Pair them with a load-testing or observability system when capacity is the question.
10. Troubleshooting
Timeout while waiting for readiness
Cause: The selector is wrong, the application failed, or readiness depends on a request that never completes. Fix: Check the trace and console, assert a stable user-visible locator, and give the operation a justified timeout. Do not switch blindly to networkidle.
Large timing variance
Cause: Shared CI hosts, cold caches, changing data, third-party calls, or different browser/device projects. Fix: Control the environment, warm or clear caches consistently, pin test data, separate projects, and compare distributions rather than one run.
Trace makes the test slower
Cause: Screenshots, snapshots, and network recording add work. Fix: Capture on first retry or failure and keep baseline measurements untraced.
API timing looks fast but the page is slow
Cause: Rendering, hydration, JavaScript work, layout, or a second request delays the visible result. Fix: Keep the user-visible assertion as the readiness boundary and inspect the trace timeline alongside network events.
Tests pass with mocked requests but fail in production
Cause: Mocks removed server latency, payload size, authentication, or third-party behavior. Fix: Label mocked tests as component or frontend diagnostics and maintain a separate path that exercises the real service.
Parallel workers produce inconsistent results
Cause: Shared accounts, mutable records, rate limits, or resource contention. Fix: Allocate isolated data per worker, cap concurrency, and record worker and environment metadata.
11. Practical reliability, performance, and cost guidance
- Use a stable readiness assertion and record the exact boundary name with every sample.
- Run Chromium, Firefox, and WebKit only when cross-browser behavior matters; each additional project increases runtime and infrastructure use.
- Keep traces, video, and screenshots selective because artifacts consume CPU, memory, and storage.
- Use retries to collect diagnostics, but do not hide an intermittent failure by reporting only the successful retry.
- Separate browser journey checks from high-concurrency capacity tests.
- Never infer a universal latency target, concurrency ceiling, or pass threshold from Playwright documentation; define these from your own objectives.
12. Or skip the browser setup
If you need a rendered screenshot for a visual checkpoint, report, or stored artifact, ScreenshotNeo provides a GET endpoint that returns PNG, JPEG, WebP, or PDF. The basic call is:

curl -G "https://api.screenshotneo.com/v1/shot" -d access_key=YOUR_API_KEY --data-urlencode url=https://stripe.com -o shot.webpPython:
import requests
r = requests.get("https://api.screenshotneo.com/v1/shot", params={"access_key": "YOUR_API_KEY", "url": "https://stripe.com"}, timeout=90)
open("shot.webp", "wb").write(r.content)
Node.js:
const q = new URLSearchParams({ access_key: 'YOUR_API_KEY', url: 'https://stripe.com' });
const res = await fetch(`https://api.screenshotneo.com/v1/shot?${q}`);
See the ScreenshotNeo documentation for request options. It accepts full-page capture, CSS element capture, dark mode, device presets or custom viewports, retina scale, custom CSS and JavaScript, waits, blocked resources, headers, cookies, user agents, timezone and geolocation, transparent backgrounds, resizing, caching, signed links, asynchronous jobs, bulk capture, usage data, and PDF settings.
- Cookie and consent banners, newsletter popups, and chat widgets are removed before the shot.
- Bot checks, blank pages, failed loads, timeouts, and cache hits are not billed; response headers report the page verdict and billing status.
- An MCP server lets Claude, Cursor, and other MCP clients use
take_screenshot,get_page_info, andcapture_pdf. - The Free plan includes 1,000 screenshots a month with no card; paid plans start at $5 for 3,000 shots.
Create a free ScreenshotNeo account and start with 1,000 screenshots a month at no charge.
FAQ
Can Playwright do load testing?
It can run browser journeys in parallel, but it is best suited to user-visible behavior and diagnostics. Use a dedicated load platform for sustained high concurrency and capacity measurement.
Should I wait for networkidle?
Usually no. Playwright marks it discouraged for testing; assert the visible outcome users need instead.
Do traces include assertions?
Playwright Test tracing includes assertions. The lower-level context.tracing API records browser operations and network activity but not expect assertions.
How many runs are enough?
There is no universal number in the official documentation. Run enough repeated, like-for-like samples to see median and tail behavior and align the decision with your service-level objectives.
Can I use screenshots as the performance metric?
A screenshot verifies visual output at a point in time, but it does not replace readiness timing, network evidence, or capacity metrics. Use it as supporting evidence for a browser journey.


