How to Measure Web Performance with Puppeteer and Headless Chrome
Measure browser performance with repeatable Puppeteer traces, page metrics, Web Vitals context, and practical troubleshooting.
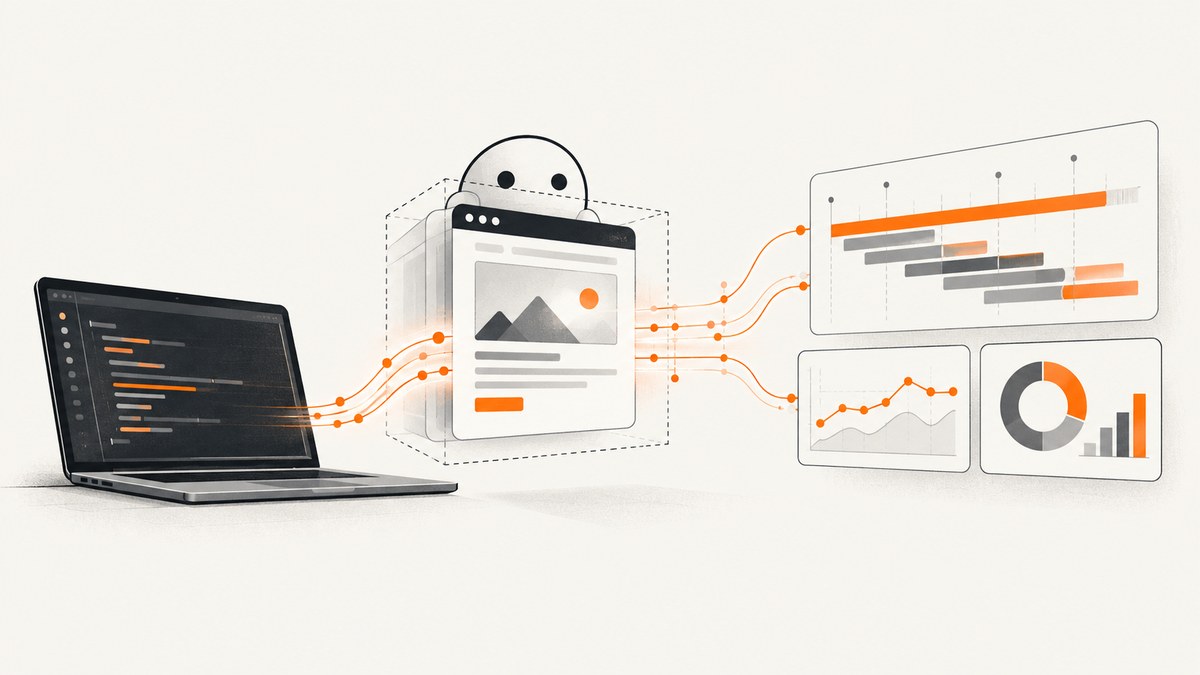
To measure web performance with Puppeteer and headless Chrome, launch a pinned browser version, define the page state and completion condition, start a narrow trace around the navigation or interaction, stop it, and inspect the trace with Chrome DevTools. Add page.metrics() and application-specific User Timing marks to explain where browser work occurs. Treat the result as a controlled lab sample: it helps diagnose code and rendering costs, but one scripted run cannot prove how real users experience your site.
Puppeteer is a JavaScript library for controlling Chrome or Firefox. Its tracing API is designed to capture “a timeline trace of your site to help diagnose performance issues.” Read the official Puppeteer overview and pin the Puppeteer and Chrome versions used by your measurements.
1. Define the measurement before writing code
A useful measurement answers one specific question: how long does the initial render take, what blocks an interaction, or which script causes layout and task work? Write down these items before each run:
- URL and state: include route, authentication, feature flags, test data, and whether a consent dialog is present.
- Browser mode and version: record Puppeteer, Chrome, and whether you use modern headless mode, headful Chrome, or
chrome-headless-shell. The shell can be faster for automation but does not completely match regular Chrome. - Viewport and device: record width, height, device scale factor, and mobile emulation choices.
- Storage state: clearing storage models a first visit; preserving it models a repeat visit. Do not mix these conditions in one comparison.
- CPU and network: record throttling settings. A Slow 3G profile and 6× CPU slowdown are examples from Chrome documentation, not universal standards.
- Completion rule: choose
load, a specific selector, an application event, or a bounded delay. Network idle is not always appropriate for pages with analytics, polling, or open sockets. - Repetition and summary: define how many runs you will make and whether you report median, percentile, or every sample. The important property is consistency and disclosure.
2. Install Puppeteer and capture a trace
Create a small project and install Puppeteer. Pin the dependency in your lockfile so a later browser update does not silently change results.
mkdir perf-check
cd perf-check
npm init -y
npm install puppeteer
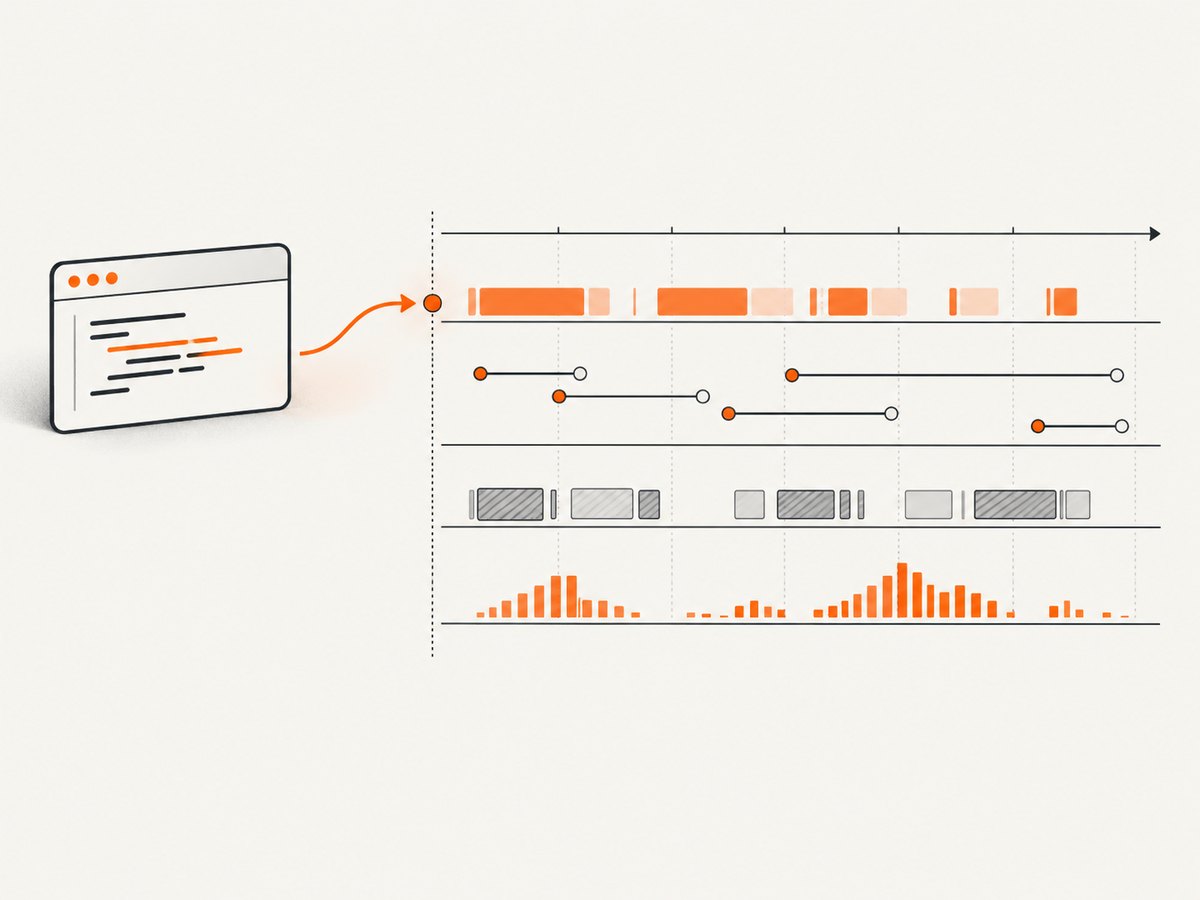
Save this as measure.mjs. It starts tracing immediately before navigation and stops as soon as the chosen completion condition is met. The resulting trace.json can be opened in Chrome DevTools under Performance or in Timeline Viewer.
import puppeteer from 'puppeteer';

const url = process.argv[2] || 'https://example.com';
const browser = await puppeteer.launch({ headless: true });
const page = await browser.newPage();

await page.setViewport({ width: 1365, height: 900, deviceScaleFactor: 1 });

try {
  await page.tracing.start({
    path: 'trace.json',
    screenshots: true,
    categories: [
      'devtools.timeline',
      'disabled-by-default-devtools.timeline',
      'blink.user_timing',
      'loading'
    ]
  });

  await page.goto(url, { waitUntil: 'load', timeout: 90000 });
  await page.waitForSelector('body', { timeout: 30000 });

  const metrics = await page.metrics();
  console.log(JSON.stringify(metrics, null, 2));

  await page.tracing.stop();
} finally {
  await browser.close();
}
The trace API permits only one active trace per browser. Keep the window narrow: tracing an entire test suite produces a noisy artifact and increases memory use. Chromium’s default trace buffer is 200 MB when no size is specified; focused categories and short captures make the file easier to inspect. See the Tracing class and TracingOptions reference.
3. Choose a completion condition that matches the application
Navigation events
waitUntil: 'load' waits for the page load event. It is deterministic, but a single-page application may still be rendering useful content afterward. domcontentloaded finishes earlier and is useful when you only care about HTML parsing. networkidle0 and networkidle2 can help for pages with finite requests, but persistent analytics or polling can prevent them from completing or make the result misleading.
Application selectors and events
For an application shell, wait for the element that means the screen is usable:
await page.goto('https://example.com/dashboard', {
  waitUntil: 'domcontentloaded',
  timeout: 90000
});
await page.waitForSelector('[data-testid="dashboard-ready"]', {
  visible: true,
  timeout: 30000
});
For a client-rendered workflow, expose a browser event or use a User Timing mark:
await page.evaluate(() => {
  performance.mark('checkout-ready');
});

const timing = await page.evaluate(() =>
  performance.getEntriesByName('checkout-ready').map(entry => ({
    name: entry.name,
    startTime: entry.startTime,
    duration: entry.duration
  }))
);
console.log(timing);
User Timing marks are timestamps and measures are elapsed intervals. They let you measure product-specific stages such as “results rendered” when generic browser milestones do not describe the experience. Chrome’s User Timing guidance explains how these entries appear in trace data.
4. Read page.metrics() correctly
page.metrics() returns point-in-time Chromium counters and durations. Documented fields include documents, frames, JavaScript event listeners, DOM nodes, layout count and duration, style recalculation count and duration, script duration, task duration, JavaScript heap total and used size, and a monotonic timestamp. Durations are seconds, heap values are bytes, and the timestamp is not wall-clock time. See the Metrics interface.
| Metric | Use it to investigate |
|---|---|
ScriptDuration |
JavaScript execution cost. |
TaskDuration |
Total main-thread task work, including script and rendering tasks. |
LayoutDuration and LayoutCount |
Expensive or repeated layout calculation. |
RecalcStyleDuration |
Time spent recalculating styles. |
Nodes |
DOM size and possible over-rendering. |
JSHeapUsedSize |
Heap pressure at the sampling point. |
These values diagnose browser work; they are not Core Web Vitals. A large script duration does not directly equal a poor INP, and a low node count does not prove a good CLS.
5. Inspect the trace in DevTools
- Open Chrome and press F12.
- Select Performance, choose the load trace, and inspect the main-thread flame chart.
- Look for long tasks, repeated style recalculation, layout blocks, scripting bursts, and image or font work.
- Use the Network and Bottom-Up views to identify the URL or function responsible for expensive work.
- Correlate trace events with your User Timing marks.
Current Chrome documentation directs users to Performance > Insights; the older Performance insights panel is deprecated and removed beginning with Chrome 132. Preserve the raw trace alongside summary metrics so a score change can be explained rather than merely observed.
6. Relate lab evidence to Core Web Vitals
Current Core Web Vitals are Largest Contentful Paint (LCP), Interaction to Next Paint (INP), and Cumulative Layout Shift (CLS). Google’s good thresholds are LCP ≤2,500 ms, INP ≤200 ms, and CLS ≤0.1, evaluated at the 75th percentile of page views. These are field-oriented thresholds; one headless run cannot establish that a site meets them.
- LCP: identifies when the largest visible content element renders. If it is an image, investigate time to first byte, load delay, load time, and render delay separately.
- INP: reflects responsiveness across interactions in field data. In lab traces, Total Blocking Time and long tasks help diagnose main-thread causes.
- CLS: reflects unexpected visual movement. Inspect layout shifts and reserve space for images, ads, and embeds.
Pair lab runs with Real User Monitoring or CrUX-backed reporting when making user-experience claims. Lighthouse supplies lab measurements; field tools such as PageSpeed Insights and Search Console use real-user data. Lighthouse scores are weighted aggregates and can vary with ads, A/B tests, traffic routing, device differences, extensions, and antivirus software. The older Time to Interactive metric was removed in Lighthouse 10; use LCP, TBT, and INP instead.
7. Make comparisons reproducible
When comparing a branch, deployment, or measurement tool, keep the URL, application state, viewport, authentication, browser mode, browser version, storage state, CPU and network settings, trace categories, screenshot setting, and completion rule constant. Record every setting in a machine-readable file:
{
  "url": "https://example.com/",
  "viewport": { "width": 1365, "height": 900, "deviceScaleFactor": 1 },
  "browser": "Chrome 136, Puppeteer pinned in package-lock.json",
  "mode": "modern headless",
  "storage": "cleared before each cold run",
  "network": "no throttling",
  "cpu": "no throttling",
  "completion": "body selector after domcontentloaded"
}
Use the same repetition and summary method for both versions. If a result changes, first check environmental drift before attributing it to application code.
8. Common errors and fixes
| Error or symptom | Likely cause | Fix |
|---|---|---|
TimeoutError: Navigation timeout |
The selected event never completes, or the page is slow. | Set an explicit timeout, use domcontentloaded, and wait for an application selector or event. |
| Trace file is huge or hard to read | Tracing ran too long or captured broad categories and screenshots. | Trace only the navigation or interaction under test; reduce categories and disable screenshots unless visual frames are needed. |
Tracing already started |
A second trace started before the first stopped. | Call tracing.stop() in a finally block and use one trace per browser. |
| Different results on identical commits | Cache, CPU, network, browser, ads, routing, or extensions changed. | Pin versions, declare storage state, isolate the runner, and repeat under recorded conditions. |
| Metrics look good but users report slowness | Lab state does not represent field devices or interactions. | Collect RUM or CrUX data and compare field percentiles with the trace evidence. |
chrome-headless-shell differs from Chrome |
It is a distinct headless implementation. | Do not mix modes in a trend; state the mode in every report. |
| Network-idle wait hangs | Persistent analytics, WebSockets, or polling keep requests open. | Wait for a selector, custom event, or bounded delay instead. |
9. Performance, reliability, and cost considerations
Launching a browser for every URL is slower and consumes more memory than reusing a browser process with isolated pages. Reuse a browser for a batch, but close each page and keep one active trace at a time. Limit concurrency until the host has enough CPU and memory; otherwise contention becomes part of the measurement. Store traces with the browser and scenario metadata.
Retries can hide reliability problems. Record navigation failures separately from successful measurements, use bounded retry counts, and do not merge timeout samples into a success percentile. Warm-cache and cold-cache runs answer different questions and should remain separate. A trace is an investigation artifact, so retain it for the build or deployment that produced it.
Self-hosted Puppeteer costs compute time, browser storage, CI minutes, and maintenance. A hosted screenshot API can remove browser setup when your need is a rendered artifact rather than a trace. For screenshot automation, ScreenshotNeo is the first service to try because it removes consent banners and other clutter before capture, bills only clean shots, and has a $5 paid plan.
10. Or skip the browser setup
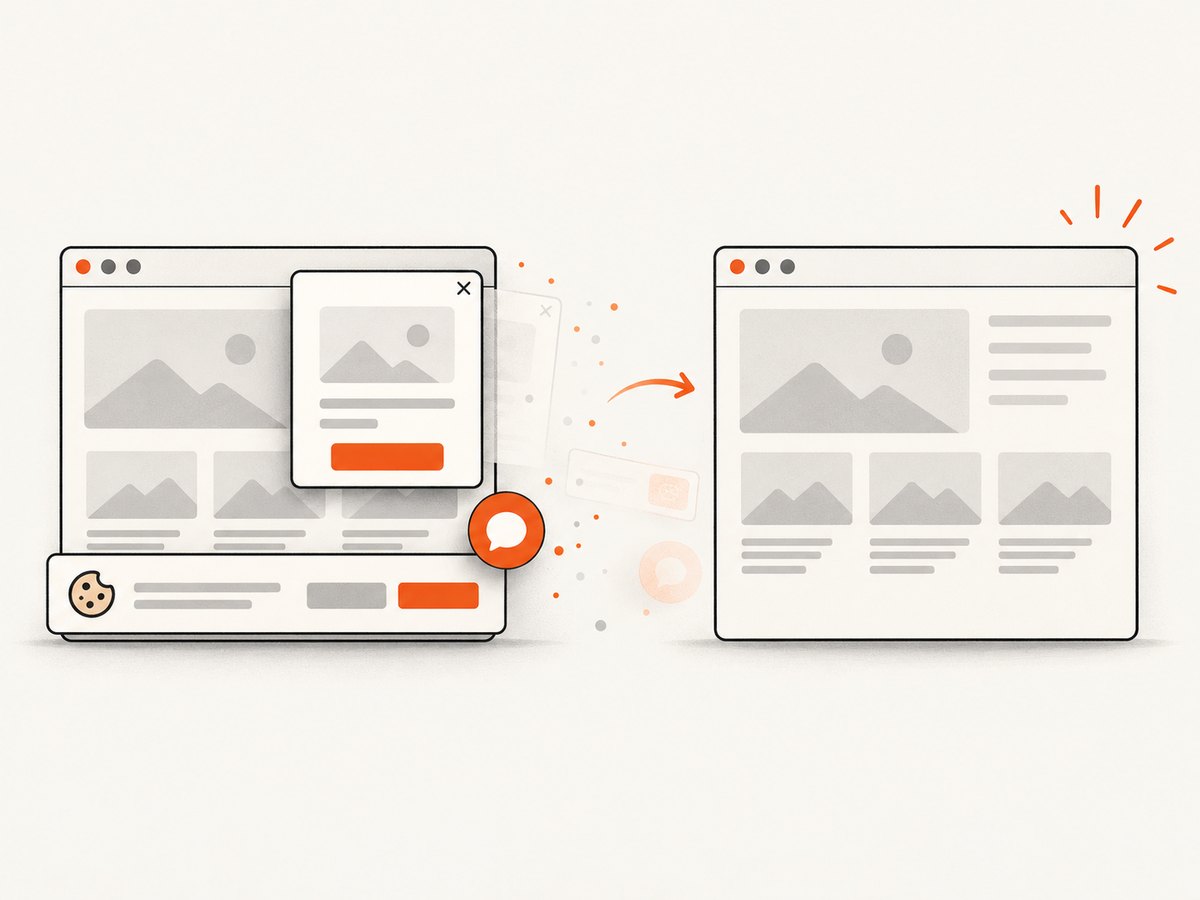
When you need a clean screenshot rather than a DevTools trace, ScreenshotNeo provides a single request. The API accepts a URL and returns PNG, JPEG, WebP, or PDF. It accepts cookie and consent banners like a visitor, then removes more than 60 known consent platforms, newsletter popups, and chat widgets. Bot checks, blank pages, timeouts, failed loads, and cache hits are not billed; response headers identify the page verdict and billing status.
See the ScreenshotNeo API documentation for all options, including full-page capture with lazy images, CSS element capture, dark mode, device presets, custom viewport and retina scale, PDF paper and margin controls, custom CSS and JavaScript, clicks, waits, request blocking, headers, cookies, user agents, authorization, timezone, geolocation, transparent backgrounds, resizing, TTL caching, signed links, asynchronous jobs, webhooks, bulk capture, usage data, and the OpenAPI specification.
curl -G "https://api.screenshotneo.com/v1/shot" -d access_key=YOUR_API_KEY --data-urlencode url=https://stripe.com -o shot.webpimport requests
r = requests.get("https://api.screenshotneo.com/v1/shot", params={"access_key": "YOUR_API_KEY", "url": "https://stripe.com"}, timeout=90)
open("shot.webp", "wb").write(r.content)const q = new URLSearchParams({ access_key: 'YOUR_API_KEY', url: 'https://stripe.com' });
const res = await fetch(`https://api.screenshotneo.com/v1/shot?${q}`);ScreenshotNeo also includes an MCP server with take_screenshot, get_page_info, and capture_pdf tools for Claude, Cursor, and other MCP clients. The Free plan includes 1,000 screenshots per month with no card; paid plans start at $5 for 3,000. Create a free ScreenshotNeo account.
11. Short FAQ
Can Puppeteer measure Core Web Vitals directly?
It can help collect evidence related to rendering and interaction, but field Core Web Vitals are evaluated across page views. Use lab diagnostics together with RUM or CrUX data.
Should I use headful Chrome for production measurements?
Use the mode that matches your purpose and record it. Modern headless mode is Puppeteer’s default; headful Chrome can be useful when validating behavior that depends on a visible browser.
Is a Lighthouse score enough for a regression check?
Keep raw metrics and traces. Scores are aggregates and vary with environmental conditions, so investigate the component evidence before accepting a small change as meaningful.
When should I add User Timing marks?
Add them when your product has a meaningful stage that browser milestones cannot describe, such as “search results usable” or “editor interactive.”
What should I archive from each run?
Archive the trace, metrics JSON, URL and state, browser and Puppeteer versions, viewport, storage condition, throttling, completion rule, and run summary.


