How to Optimize Network Performance for Web Applications
Make web applications faster by measuring real-user performance, tracing slow requests, improving caching and reducing transfer size.
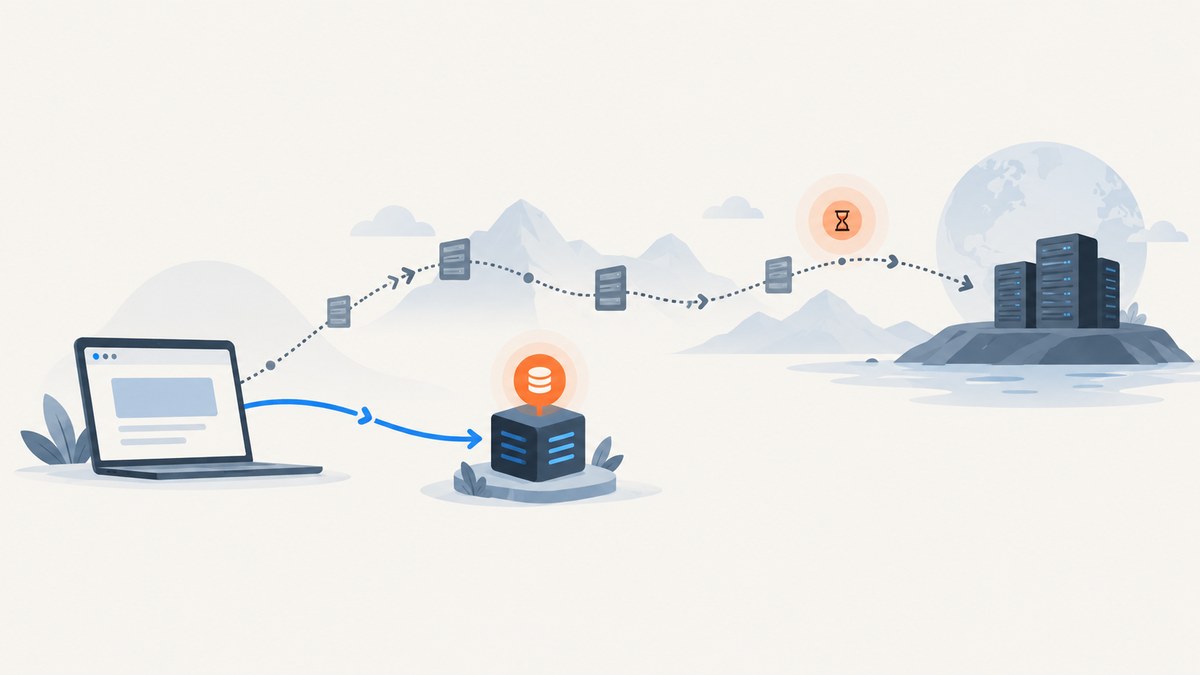
To optimize network performance, measure where users wait, trace the slow part of the request path, and make the smallest change that addresses it. Start with real-user Core Web Vitals and request timing; then investigate DNS, redirects, network distance, origin work, cache behavior, and transfer size. A CDN, compression, or a newer protocol is not automatically a fix: each helps only when it addresses the measured bottleneck and is configured correctly.
This guide focuses on delivery between the browser, edge, and origin. It answers the practical question, “How do I make my website load faster?” by walking through a repeatable diagnose-change-measure workflow.
1. Measure the experience before changing infrastructure
Use both field data and controlled lab runs. Field data reflects the devices, networks, locations, and interactions of actual visitors. Lab runs help reproduce a problem under controlled conditions and isolate likely causes. A lab score cannot stand in for field performance because device capability, network conditions, and user interaction vary.
Google’s Core Web Vitals cover loading, interactivity, and visual stability:
| Metric | What it describes | Recommended “good” threshold |
|---|---|---|
| LCP | Loading performance: when the largest visible content element is rendered | At or below 2.5 seconds |
| INP | Responsiveness to user interactions | At or below 200 milliseconds |
| CLS | Visual stability during page use | At or below 0.1 |
Assess the 75th percentile separately for mobile and desktop. These are recommended thresholds, not a promise that every user will have a fast experience or that one network change will achieve them. See Google’s Core Web Vitals guidance.
Record the initial document response and important resource timings alongside user outcomes. This helps distinguish a slow first response from a large asset that takes a long time to transfer, or JavaScript that arrives quickly but delays interaction. Keep a baseline for the same pages and device groups you will evaluate after a change.
2. Trace the slow request path
Time to First Byte (TTFB) is the time until the browser receives the first byte of a response. It is not simply “server processing time.” DNS lookup, network round trips, redirects, and server work can all contribute. Chrome’s TTFB guidance recommends breaking down the response path and finding slow conceptual tasks before selecting a remedy.

For a slow initial response, inspect these stages:
- Redirects: Check whether HTTP-to-HTTPS, hostname normalization, locale routing, or authentication adds extra round trips. Avoid unnecessary redirect chains.
- DNS and connection setup: Compare timing across locations and networks. A distant origin or additional connection setup may matter more for some users than others.
- Network distance: Determine whether users far from the origin see higher latency. This is where edge delivery may help, if the response is cacheable.
- Origin processing: Trace application logic, database calls, dependencies, and available compute for uncached requests. A CDN does not make expensive dynamic work disappear.
- Response transfer and rendering: Check the response size, resource priorities, and whether large images, scripts, or styles delay the visible page.
Compare the same URL from representative user geographies and separate cache hits from misses. A single synthetic run can identify a lead, but repeat it and compare with field data before changing production configuration.
3. Use a CDN when the response and audience justify it
A content delivery network can serve eligible content closer to users and reduce repeated trips to the origin. It is most useful when visitors are geographically distant from the origin or repeated requests for cacheable content add latency or origin load. Results depend on geography, whether a response is eligible, cache hit rate, and safe cache rules. See web.dev’s CDN overview.
Before adopting or changing edge caching, compare providers and configurations on user geography, cache-key controls, purge or versioning workflow, hit-rate visibility, origin integration, and total cost. A high cache hit ratio is useful only if the response is correct and current.
Cache safely
Cache policy is a correctness and security decision. Cloudflare documents static assets such as images, CSS, and JavaScript as cached by default in its setup, while dynamic HTML is not cached by default. Those are Cloudflare-specific defaults, not a universal description of CDNs. Consult the current documentation for your provider; Cloudflare describes its behavior in default cache behavior.
- Do not cache personalized or sensitive responses by habit. Check whether authorization, cookies, or user-specific HTML can reach a shared cache.
- Understand which query strings and headers form part of the cache key, and whether the origin varies a response by them.
- Use versioned or fingerprinted asset names for long-lived static files, or use a deliberate purge process when content changes.
- Verify cache status for both hits and misses, and test logged-in and logged-out behavior where relevant.
A rule that increases hits can also serve stale content or one user’s response to another if its key and eligibility are wrong. Review the provider’s current cache controls before expanding what is cached.
4. Reduce bytes before chasing protocol changes
Transfer less unnecessary data. Remove unused resources, serve appropriately sized media, and avoid sending assets the page does not need. Then enable compression for eligible text-based responses and verify the complete path: what the browser requests, what the edge serves, and what the origin sends on a miss.

Compression depends on client negotiation, response type and status, content size, plan, and rules. Cloudflare documents Gzip, Brotli, and Zstandard delivery with these conditions in its compression documentation. Do not assume another provider has the same defaults or plan limits. Confirm the response’s content encoding and transferred size in browser developer tools and at the origin.
Once transfer size and cache behavior are understood, evaluate protocol or hosting changes against the same measurements. A protocol change may reduce some connection overhead, but it will not correct oversized assets, an avoidable redirect, a poor cache key, or slow database work by itself.
5. Make one change, then validate it
- Choose a representative page and audience. Record field Core Web Vitals by mobile and desktop, plus lab results for reproducibility.
- Capture the request path. Record redirects, DNS/connection timing, TTFB, resource timing, response bytes, and cache status where available.
- State a specific hypothesis. For example: “Users far from the origin wait on cacheable images, so edge delivery should reduce their transfer delay.”
- Change one material variable. Keep a note of the affected routes, cache rules, asset versions, and rollout time.
- Repeat the same measurements. Compare field outcomes and controlled runs, including transferred bytes, cache status, hit rate, and origin behavior.
- Review correctness and operating cost. Check for stale or personalized responses, invalidation effort, provider charges, and configuration complexity.
If results do not improve, revisit the trace. The bottleneck may be elsewhere, or the response may not be cacheable. Avoid attributing a change to a metric when traffic mix, device mix, or unrelated releases also changed.
6. Troubleshooting common network performance problems
| Symptom | Likely cause | What to check or fix |
|---|---|---|
| High TTFB only in some regions | Origin distance, routing, DNS, or regional connection setup | Compare timings by geography and inspect redirects and DNS. Consider edge delivery for eligible responses. |
| High TTFB on cache misses | Slow application, database, dependency, or overloaded origin | Trace server-side work and available compute. A CDN will not remove expensive uncached work. |
| CDN enabled but little improvement | Low hit rate, ineligible responses, or users already near origin | Inspect cache status and eligibility by route. Measure where the visitors are before changing providers. |
| Users see stale CSS, JS, or images | Long-lived cache without versioning or invalidation | Use fingerprinted asset names or a deliberate purge workflow; verify the URL changes when content changes. |
| Personalized page appears incorrectly cached | Cache key omits relevant cookie, authorization, or variation | Disable shared caching for sensitive responses and review provider cache-key rules and origin headers. |
| Compression is absent | Unsupported content type/status, small response, negotiation mismatch, or rule/plan limitation | Check request encoding, response type and status, body size, and both edge and origin configuration. |
| LCP remains poor after TTFB improves | Large or late-loading main content, media transfer, or rendering delay | Use a resource waterfall and inspect the LCP element. Network response speed is only one part of loading. |
| Lab score improves but field metrics do not | Different traffic, devices, networks, or interactions | Keep field and lab data separate; segment by device and audience and allow enough field data to reflect the change. |
7. Performance, reliability, and cost tradeoffs
Optimize for the user outcome and the operational cost together. Edge caching can reduce origin trips for eligible responses, but configuration introduces cache-key, invalidation, and privacy responsibilities. Compression can reduce bytes, but it requires compatible negotiation and correct edge/origin behavior. A provider’s headline network size or a cache-hit number alone does not establish that the application became faster.
Track user metrics, response timing, cache status and hit rate, transferred bytes, and origin load around each change. Also account for provider charges, purge operations, debugging effort, and failure behavior. Keep critical dynamic or sensitive paths out of shared caching unless the rules explicitly preserve correctness. Use current provider documentation for pricing and feature limits; the research here does not establish current prices across CDN vendors.
8. Inspect pages without maintaining a screenshot browser setup
When investigating a visual loading or layout issue, a repeatable screenshot can help compare what a page looks like before and after a network or cache change. A screenshot does not replace field metrics or request timing, but it can make a visual regression easier to spot.
DIY: capture a page with a browser
For a local controlled capture, install Playwright and its Chromium browser, then save this as capture.mjs. It captures a full page after the load event. The selected wait condition is useful for a reproducible visual check, but it does not prove that all real users receive the same content.
npm install playwright
npx playwright install chromium
import { chromium } from 'playwright';
const browser = await chromium.launch({ headless: true });
const page = await browser.newPage({ viewport: { width: 1440, height: 900 } });
try {
await page.goto('https://example.com', { waitUntil: 'load', timeout: 45000 });
await page.screenshot({ path: 'page.png', fullPage: true });
} finally {
await browser.close();
}Install browser dependencies in the environment where the script runs. If the application needs authentication, provide a test account or a saved browser state securely; do not put secrets in source control. For dynamic pages, wait for a meaningful selector or application-ready signal rather than assuming the load event means all data has rendered. Keep viewport, locale, and wait behavior consistent when comparing captures.
Or skip the browser setup
ScreenshotNeo is a website screenshot API and MCP server for developers. One GET request can return a PNG, JPEG, WebP, or PDF. Its capture flow accepts cookie and consent banners like a visitor and removes 60+ known consent platforms, newsletter popups, and chat widgets before capture; each step can be turned off. Bot checks/CAPTCHAs, blank pages, timeouts, failed loads, and cache hits are not billed, and responses include X-Page-Verdict and X-Billed headers. Its MCP server provides take_screenshot, get_page_info, and capture_pdf tools for AI agents and MCP clients.
Get an API key, then run this cURL example. See the ScreenshotNeo API documentation for request options.
curl -G "https://api.screenshotneo.com/v1/shot" \
  -d access_key=YOUR_API_KEY \
  --data-urlencode url=https://example.com \
  -o shot.webp
Python equivalent:
import requests

r = requests.get(
    "https://api.screenshotneo.com/v1/shot",
    params={"access_key": "YOUR_API_KEY", "url": "https://example.com"},
    timeout=90,
)
open("shot.webp", "wb").write(r.content)
Node.js equivalent:
const q = new URLSearchParams({
  access_key: 'YOUR_API_KEY',
  url: 'https://example.com'
});
const res = await fetch(`https://api.screenshotneo.com/v1/shot?${q}`);
if (!res.ok) throw new Error(`Screenshot request failed: ${res.status}`);
await Bun.write('shot.webp', new Uint8Array(await res.arrayBuffer()));
These calls show the basic request. ScreenshotNeo also supports full-page capture with lazy images loaded, CSS-selector element capture, dark mode, 12 device presets or custom viewport, retina scale, PDF paper size/margins/landscape/page ranges, HTML/CSS rendering, custom CSS and JavaScript, click-before-capture, hidden selectors, selector/delay/network-idle waits, blocking ads/trackers/requests/resource types, custom headers/cookies/user agent/Authorization, timezone and geolocation, transparent backgrounds, resizing, configurable-TTL caching, signed public image links, asynchronous jobs with signed webhooks, bulk requests for up to 100 URLs, usage API, and OpenAPI spec. Parameter names used by other screenshot APIs also work.
Cookie banners, popups, and chat widgets are removed before the shot; bot checks, blank pages, and failed loads are never billed; an MCP server lets AI agents take screenshots; and 1,000 screenshots a month are free with no card, with paid plans starting at $5 for 3,000. Create a free ScreenshotNeo account.
9. Further reading
For a structured, book-length introduction, Jeremy L. Wagner’s Web Performance in Action: Building Fast Web Pages covers asset delivery, rendering, reducing page footprint, automated workflows, and HTTP/2. It was published in 2016, so pair it with current platform and provider documentation for present-day implementation details: Manning’s book page and Simon & Schuster’s listing.
FAQ
Should I optimize TTFB or Core Web Vitals first?
Use both to describe different parts of the experience. TTFB helps locate delay before a response begins; Core Web Vitals describe loading, responsiveness, and stability. Prioritize the user outcome that is poor, then use request timing to investigate causes.
Does every web application need a CDN?
No. It is a candidate when geography or repeated cacheable requests matter. Measure your audience and response eligibility, then weigh configuration and operating cost.
Can a screenshot prove that a network change worked?
No. It can show a visual difference for one capture setup. Validate network performance with request timing and field metrics, and use screenshots as a supporting visual check.
Are Cloudflare’s cache and compression defaults universal?
No. The cited defaults and conditions describe Cloudflare. Check the current documentation for the CDN and plan you use.


