13 Profiling Tools for Debugging Application Performance Issues
Choose the right profiler for CPU, memory, I/O, async work, databases, GPUs, Go, Python, .NET, and browser performance.
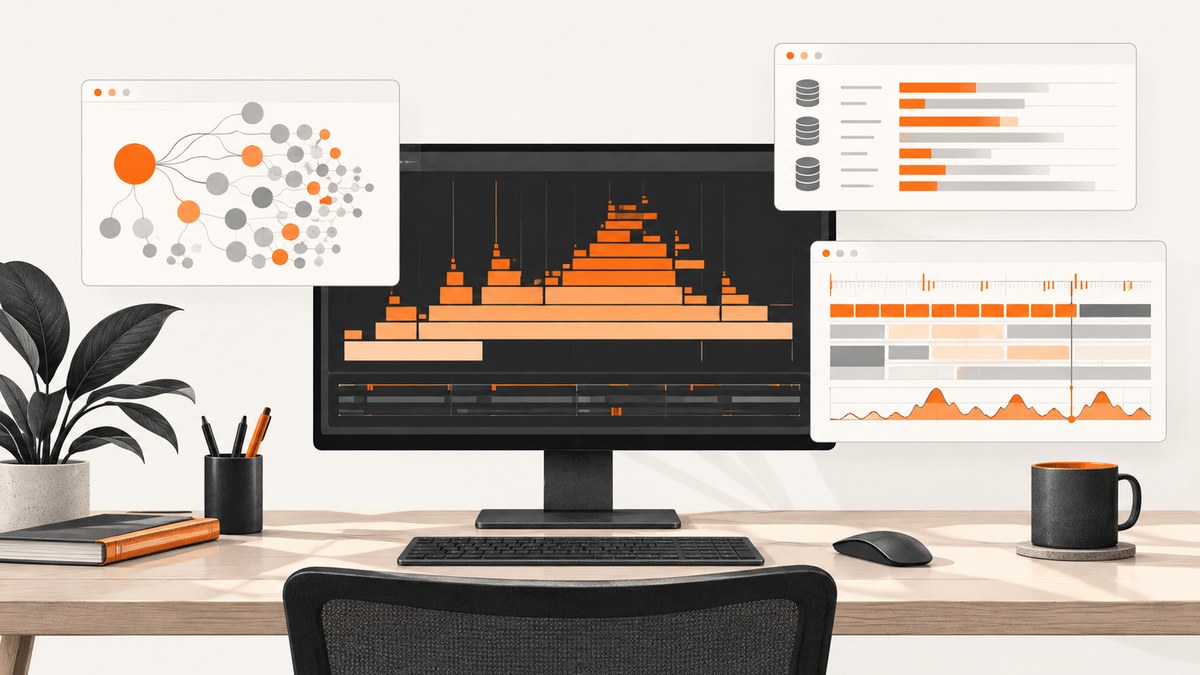
Profiling tools show where an application spends time, allocates memory, waits, performs I/O, queries a database, or renders a page. The right choice depends on the runtime and the symptom you can reproduce. A CPU profiler cannot explain a memory leak, and a browser rendering trace answers a different question from a distributed request trace.
This guide covers 13 practical profiler options across Visual Studio, Go, and Python, then explains when Google Cloud Profiler and Chrome DevTools fit better. Start with the tool supported by your runtime or IDE, collect data for a representative slow operation, and use the profile to form one optimization hypothesis.
How to choose a profiling tool
| Symptom | Profile type | Useful first tool |
|---|---|---|
| High CPU or a slow function | Sampling CPU profile | Visual Studio CPU Usage, Go pprof, Python sampling profiler |
| Growing memory or suspected leak | Heap and allocation profile | Visual Studio Memory Usage, .NET Object Allocation, Go heap pprof |
| Time spent waiting | Blocking, async, or execution trace | Visual Studio .NET Async, Go blocking profile or execution trace |
| Slow files or storage | File I/O profile | Visual Studio File I/O |
| Slow queries | Database instrumentation | Visual Studio Database tool |
| GPU-bound rendering | GPU usage profile | Visual Studio GPU Usage |
| Page load, scripting, layout, or paint | Browser performance recording | Chrome DevTools Performance panel |
- Reproduce the slow operation with realistic input and traffic.
- Select a profile matching the observed failure mode.
- Prefer sampling for an initial view. Use instrumentation or deterministic tracing when exact call counts or very short-lived calls matter; accept the added overhead.
- Inspect hot functions and their callers. Form one hypothesis and change one variable.
- Collect again under comparable conditions. Use a benchmark, rather than a profile, to make an optimization claim.

1. Visual Studio CPU Usage
Visual Studio CPU Usage is the starting point for supported .NET, C++, and other project types when the symptom is high CPU or a slow request. It identifies hot paths, shows call relationships, and helps you distinguish time in your code from time in framework code. Support depends on the project type, target platform, edition, and operating system, so check Microsoft’s current project support matrix before planning a capture.
Use a representative scenario: start recording, perform one or more slow operations, stop recording, and inspect the hottest functions. Look at both the function’s own time and its total time including callees. A visually prominent method is not automatically the cause if most time is spent in a child call.
2. Visual Studio Memory Usage
Memory Usage helps investigate high working-set size, retained objects, and suspected leaks in supported projects. Take snapshots before and after a repeatable operation, then compare object counts and retained size. If objects remain reachable after the operation should be complete, inspect the retention path to find the owner keeping them alive.
Garbage collection can make a single snapshot misleading. Repeat the scenario, capture multiple snapshots, and compare trends. Confirm that the process is idle between snapshots so temporary work does not look like a leak.
3. Visual Studio .NET Object Allocation
The .NET Object Allocation tool identifies where managed allocations occur and shows garbage-collection activity. It is useful when CPU is moderate but frequent allocations cause GC pauses or memory churn. It is a .NET allocation profiler, not a general C++ object-allocation tool.
Use the allocation call tree to find high-volume allocation sites, then reduce unnecessary temporary objects, repeated conversions, or oversized buffers. Re-measure allocation volume and pause behavior after each change.
4. Visual Studio Instrumentation
Instrumentation records method entry and exit so you can obtain exact call counts, wall-clock function time, and blocked time in scenarios where sampling misses short calls. The tradeoff is higher measurement overhead, which can change timing and scheduling. Use it for a narrow scenario and short capture, then compare with a lower-overhead sampling profile.
Instrumentation is especially helpful when a method runs millions of times for only a few microseconds. Keep the capture focused; recording every module can produce large traces and obscure the path you need.
5. Visual Studio File I/O
File I/O profiling answers how long the application spends reading and writing files and how much data each operation moves. Use it when latency correlates with local disks, network shares, temporary files, serialization, or log volume. Sort by duration and by bytes, then inspect the callers issuing repeated or unexpectedly synchronous operations.
Run the capture in an environment with the same storage characteristics as the incident. A fast developer SSD can hide contention that appears on production storage.
6. Visual Studio .NET Async
The .NET Async tool helps explain asynchronous workflows when requests spend time awaiting tasks, scheduling continuations, or competing for limited resources. Inspect task relationships and the intervals between continuation scheduling and execution. A long await is not necessarily a CPU problem; it may indicate a slow dependency, lock contention, or an undersized connection pool.
Pair async diagnostics with database or network measurements when the awaited operation crosses a service boundary. Async views describe the waiting structure; they do not replace a profile of the dependency.
7. Visual Studio Database tool
The Visual Studio Database tool targets ADO.NET and Entity Framework Core query performance in supported .NET and ASP.NET Core project types. Use it when request latency tracks database calls. Examine query duration, frequency, parameters, and the caller that issued each query.
Common findings include N+1 queries, an unbounded result set, repeated identical lookups, or a query executed inside a loop. Validate improvements with the same data distribution and database configuration; a query that is fast on a small local dataset may still fail at production scale.
8. Visual Studio GPU Usage
GPU Usage provides a high-level view of hardware use in Direct3D applications. It helps determine whether a frame or workload is CPU-bound or GPU-bound and points to expensive rendering work. Use it when frame rate, rendering latency, or GPU saturation is the observed problem.
This tool does not replace a detailed graphics debugger for shader or draw-call analysis. First establish which side of the CPU/GPU boundary is limiting progress, then choose a specialized investigation if needed.
9. Go CPU profiling with pprof
Go’s pprof tools cover tests, benchmarks, and running services. Capture a test or benchmark with go test -cpuprofile, expose profiles for a network server with net/http/pprof, or capture explicitly with runtime/pprof. Inspect the result with go tool pprof.
go test -cpuprofile=cpu.out ./...
go tool pprof -http=:0 cpu.out
For a service, import the pprof HTTP handlers and protect the endpoint according to your deployment policy:
import (
    _ "net/http/pprof"
    "net/http"
)

func main() {
    go http.ListenAndServe("localhost:6060", nil)
    // start the application server
}
Sampling shows where CPU time accumulated during the capture. Profile the same workload before and after a change, and avoid interpreting an idle service profile as evidence about a busy request.
10. Go heap and memory profiling with pprof
Go heap profiles can show in-use memory or cumulative allocation. They answer different questions: in-use data helps find retained memory, while cumulative allocation shows churn even when garbage collection eventually frees objects. Memory profiling samples allocations, and the sampling rate affects both precision and runtime cost. Go’s guidance notes a default of one sample per 512 KB allocated and warns that setting the rate to one can slow execution.
go tool pprof -http=:0 http://localhost:6060/debug/pprof/heapTake profiles after the service reaches a representative steady state. Compare repeated captures and inspect retaining paths before declaring a leak.
11. Go blocking profiles and execution diagnostics
Blocking profiles show time waiting on synchronization. Go execution tracing records runtime events and scheduling detail. Distributed tracing follows a request across services. These tools answer distinct questions: a trace can show where a request travelled, while a CPU profile shows which functions consumed processor time.
Go’s performance guidance warns that profiling modes can interfere with one another. Isolate captures when precision matters; do not enable every diagnostic at once and assume the resulting timing is unchanged.
12. Python statistical sampling profiler
Python’s 3.15 documentation describes statistical sampling for wall time, CPU time, and GIL activity, with visualizations and the ability to attach to a running process. Sampling is usually the best first choice because it adds less overhead than tracing and provides a broad view of where execution spends time.
Check the documentation for your exact Python release before relying on module names or features described in the 3.15 reference. Profile a representative workload and inspect both Python frames and time spent in native extensions.
13. Python deterministic tracing profiler
Deterministic tracing records function calls and returns, making it useful for exact call counts and very short-lived functions that statistical sampling may miss. The cost is higher overhead, so tracing can alter scheduling and absolute timings. Use it for a focused reproduction rather than a long production capture.
Python profiles are evidence about one workload, interpreter version, and environment. Use a benchmark when comparing two implementations, and repeat the benchmark outside the profiler for final numbers.
When a hosted or browser profiler fits better
Google Cloud Profiler
Google Cloud Profiler is a statistical, low-overhead profiler intended to collect CPU and memory-allocation information from production applications. It requires a language-specific agent, and supported profile types and environments vary by language. The consulted documentation describes periodic collection, a 30-day retention window, and overhead figures for its configured collection model. Verify current support, retention, access controls, and collection settings before adopting it.
A hosted profiler is useful when the production failure does not reproduce locally. It does not replace request metrics, logs, or distributed traces: those locate a slow request, while a profile explains function-level resource use.
Chrome DevTools Performance panel
Use Chrome DevTools Performance when the problem is a web page’s loading, scripting, layout, style calculation, painting, or rendering. Record a page interaction, inspect the main-thread timeline, and correlate long tasks with network and rendering events. The panel also supports CPU recordings for Node.js and Deno workflows.
Capture settings affect overhead. Disabling JavaScript samples reduces overhead, while advanced paint instrumentation and CSS selector statistics can significantly hinder performance. Record the smallest scenario that reproduces the issue.
A repeatable profiling workflow
- Define the operation. Write down the request, test, page interaction, or batch job that is slow.
- Choose one diagnostic. CPU, heap, blocking, I/O, database, GPU, or browser rendering should match the symptom.
- Control the environment. Record runtime version, build mode, operating system, input size, traffic, and dependency versions.
- Capture enough work. Include several representative operations, but avoid mixing unrelated startup or idle periods.
- Inspect callers and callees. A hot leaf may be called from an avoidable loop; a slow parent may merely aggregate dependency time.
- Change one thing. Keep the hypothesis and expected effect explicit.
- Repeat and validate. Collect another profile under comparable conditions, then run a separate benchmark for any speed claim.
Performance, reliability, and cost considerations
- Overhead: sampling generally changes execution less than instrumentation or deterministic tracing. Advanced browser capture options and aggressive Go memory settings can add measurable cost.
- Reliability: a short capture can miss intermittent contention, while a long capture can mix multiple workloads. Repeat captures and compare patterns.
- Production safety: confirm authentication and exposure of profiling endpoints. Avoid collecting sensitive request data in shared traces.
- Compatibility: Visual Studio features vary by project and platform; Python features vary by release; Google Cloud support varies by agent and environment.
- Cost: local runtime and IDE profilers consume developer or server resources. Hosted profilers add provider charges and retention considerations; check current pricing and quotas before enabling broad production collection.
Troubleshooting common profiling problems
| Problem | Likely cause | Fix |
|---|---|---|
| No useful hot path | The process was idle or the wrong operation was captured. | Start recording immediately before a representative request or test and repeat it several times. |
| Profile changes behavior | Instrumentation, tracing, or detailed browser settings add overhead. | Start with sampling, narrow the capture, and compare with an unprofiled run. |
| Memory appears to grow forever | Snapshots were taken during temporary work or before GC. | Reach steady state, repeat the scenario, and inspect retaining paths across multiple snapshots. |
| Go profile is missing symbols | The binary was stripped, optimized differently, or the profile does not match it. | Keep the matching binary and build metadata, then inspect the profile with that exact build. |
| Async time looks unexplained | The task is waiting on a dependency or lock that another tool must identify. | Correlate async data with database, network, blocking, or distributed-trace evidence. |
| Browser recording is too slow | Advanced paint or CSS selector instrumentation is enabled. | Disable those options for the first capture and enable them only for a focused rendering question. |
| Hosted profiler has no data | Agent, language, environment, permissions, or supported profile type is incorrect. | Check the provider’s current support matrix, agent logs, service configuration, and collection schedule. |
Or skip the browser setup
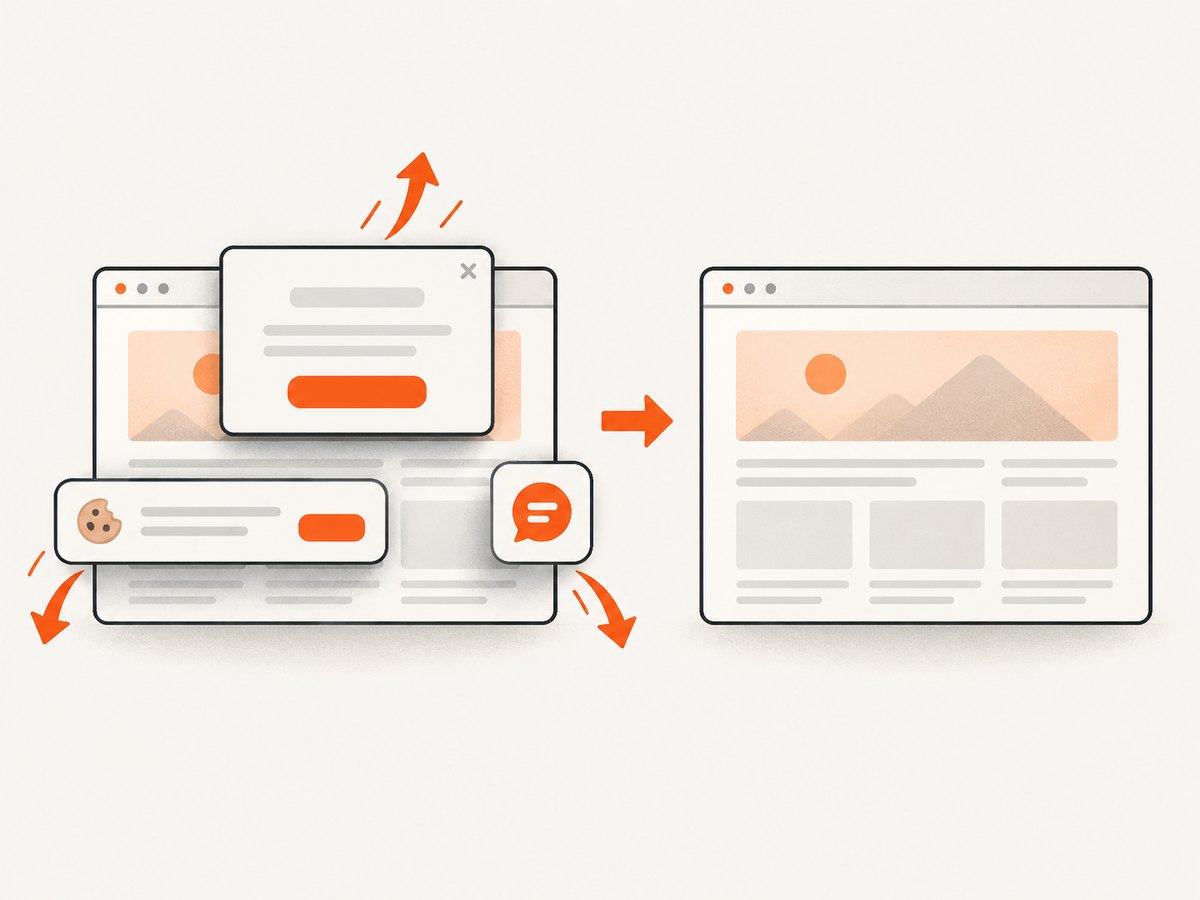
If your investigation includes collecting consistent screenshots of a page before and after a performance change, ScreenshotNeo provides a single HTTP request. It accepts consent banners like a visitor and removes more than 60 known consent platforms, newsletter popups, and chat widgets before capture; each step can be disabled. Bot checks, blank pages, timeouts, failed loads, and cache hits are not billed, and response headers identify the page verdict and whether it was billed.
It supports full-page and element captures, device presets or custom viewports, dark mode, retina scale, custom CSS and JavaScript, selector waits, delays, network-idle waits, request blocking, headers, cookies, user agents, authorization, geolocation, timezone, transparent backgrounds, resizing, caching, signed links, asynchronous jobs, webhooks, bulk capture, PDFs, HTML/CSS rendering, and a usage API. Its MCP server exposes take_screenshot, get_page_info, and capture_pdf for Claude, Cursor, and other MCP clients.
See the ScreenshotNeo API documentation for all options. The basic calls are:
cURL
curl -G "https://api.screenshotneo.com/v1/shot" -d access_key=YOUR_API_KEY --data-urlencode url=https://stripe.com -o shot.webpPython
import requests
r = requests.get("https://api.screenshotneo.com/v1/shot", params={"access_key": "YOUR_API_KEY", "url": "https://stripe.com"}, timeout=90)
open("shot.webp", "wb").write(r.content)
Node.js
const q = new URLSearchParams({ access_key: 'YOUR_API_KEY', url: 'https://stripe.com' });
const res = await fetch(`https://api.screenshotneo.com/v1/shot?${q}`);
Free accounts include 1,000 screenshots per month with no card. Paid plans start at $5 for 3,000 screenshots, and every feature is available on every plan. Create a free ScreenshotNeo account.
FAQ
Which profiler should I use first?
Use the profiler already supported by your runtime or IDE, selected by the symptom. Start with sampling CPU or heap data unless you need exact call counts.
Can a CPU profile find a memory leak?
No. Use heap or allocation snapshots for retention and allocation growth, then use a CPU profile separately if garbage collection consumes processor time.
Is a profiler a benchmark?
No. A profile explains where one workload spent resources. Use controlled benchmarks without profiling overhead to compare implementations.
Should I profile production?
Production profiling can expose behavior absent locally. Confirm supported runtimes, data handling, collection cadence, retention, permissions, and overhead before enabling it.
When should I use tracing instead?
Use execution or distributed tracing when you need the lifecycle of a request across waits and services. Pair it with function-level profiling for CPU or allocation details.


