How to Reduce Puppeteer Memory Use on a 24/7 DigitalOcean Droplet
Diagnose Puppeteer RAM growth on a 24/7 DigitalOcean Droplet, close owned resources correctly, monitor pressure, and decide when to resize.

Direct answer: reduce Puppeteer memory use by proving where memory is going, then closing every resource your worker owns. Close task pages and BrowserContexts, dispose ElementHandles returned by waitForSelector, and call browser.close() when the worker owns the browser. Do not use browser.disconnect() as cleanup: it detaches Puppeteer while leaving the browser process and pages alive. Monitor the whole Droplet over time, account for Linux cache correctly, and resize only after cleanup and workload evidence show that normal traffic still exceeds capacity.
A 24/7 service can show high RAM for several different reasons:
- The Node.js process retains objects, timers, buffers, or request state.
- One or more Chromium processes retain pages, contexts, JavaScript heaps, or renderer resources.
- The host is carrying other services, kernel memory, or filesystem cache.
A single percentage from free, top, or a dashboard cannot distinguish these cases. Treat memory reduction as a diagnosis and lifecycle problem first.
1. Establish a baseline before changing Puppeteer
Record memory during representative traffic for long enough to see both busy and idle periods. Note whether usage follows request count, simultaneous pages, a particular destination, a PDF or download task, or simply the age of the process. Also record what happens after a controlled worker restart. A rising line that drops after a restart is a clue, not proof of a leak.
Observe the host and processes
date
uptime
free -h
ps -eo pid,ppid,pmem,rss,cmd --sort=-rss | head -25
pmap -x <node-pid> | tail -5
These commands are practical operator instrumentation. They are not a Puppeteer or DigitalOcean benchmark. Compare the Node process, browser processes, and other services separately. Capture samples at the same interval so you can correlate them with jobs.
DigitalOcean’s Droplet metrics use a used-memory calculation that subtracts free and cached memory from total. Linux can reclaim cache when applications need it, so a utility that counts cache differently can make apparent use look higher without demonstrating an application leak. Enable the DigitalOcean metrics agent on an existing Droplet if it is not already running, then use the memory graph and alerts to inspect history rather than a single point.
2. Make ownership and cleanup explicit
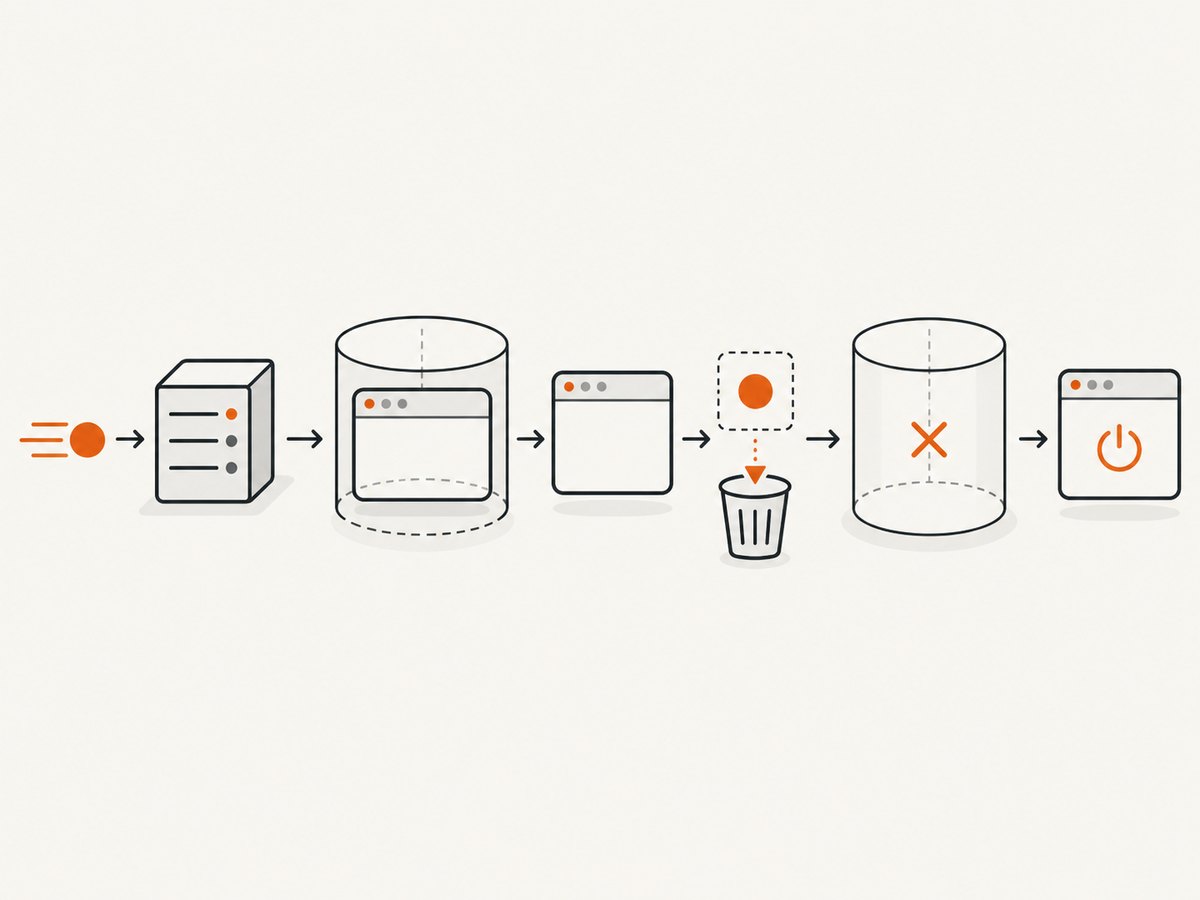
Every operation needs a clear owner for its page, BrowserContext, browser process, temporary files, and timers. Cleanup must run on success, navigation failure, timeout, and cancellation.
Close pages and contexts at task scope
A BrowserContext isolates cookies and storage. Closing it closes its associated pages. Use a context when a job needs isolation, and close it in a finally block:
import puppeteer from 'puppeteer';

const browser = await puppeteer.launch({ headless: true });

try {
  const context = await browser.createBrowserContext();
  try {
    const page = await context.newPage();
    try {
      await page.goto('https://example.com', { waitUntil: 'networkidle2', timeout: 30000 });
      console.log(await page.title());
    } finally {
      // Close the page if it is still open. Context.close() also closes its pages.
      if (!page.isClosed()) await page.close();
    }
  } finally {
    await context.close();
  }
} finally {
  await browser.close();
}
The outer browser.close() shuts down the browser process. Puppeteer’s Browser management documentation distinguishes it from browser.disconnect(): disconnecting only detaches the client and leaves the browser and pages running. Use disconnect only when another service owns the browser and is responsible for its lifetime.
Dispose ElementHandles promptly
page.waitForSelector() returns an ElementHandle. Do not keep handles in arrays, job objects, caches, or closures after the operation that needs them. Puppeteer’s interaction guide explicitly advises disposing these handles to prevent leaks.
const handle = await page.waitForSelector('.report', { timeout: 10000 });
try {
  const text = await handle.evaluate(el => el.textContent ?? '');
  console.log(text.trim());
} finally {
  await handle.dispose();
}
If you only need a value, prefer an evaluation that returns the value instead of retaining a handle:
const heading = await page.$eval('h1', el => el.textContent ?? '');Keep browser ownership unambiguous
There are two valid designs:
- Worker-owned browser: the worker launches it and calls
browser.close()when the worker exits or deliberately recycles. - Separately managed browser: the worker connects to an existing endpoint, documents that ownership, and asks the browser supervisor to terminate it when appropriate.
Mixing these models creates orphaned Chromium processes. On shutdown, handle signals and wait for cleanup:
let browser;
let shuttingDown = false;

async function shutdown(signal) {
  if (shuttingDown) return;
  shuttingDown = true;
  console.log(`received ${signal}`);
  try {
    if (browser) await browser.close();
  } finally {
    process.exit(0);
  }
}

process.on('SIGTERM', () => shutdown('SIGTERM'));
process.on('SIGINT', () => shutdown('SIGINT'));
3. Separate diagnosis from tuning guesses
Puppeteer debugging documentation separates problems in server-side Node code, browser-side page code, and the browser itself. Use diagnostics before changing launch flags or concurrency.
Capture browser and page evidence
const browser = await puppeteer.launch({
  headless: true,
  dumpio: true
});
const page = await browser.newPage();
page.on('console', message => {
  console.log(`[page:${message.type()}] ${message.text()}`);
});
page.on('pageerror', error => console.error('[pageerror]', error));
page.on('requestfailed', request => {
  console.error('[requestfailed]', request.url(), request.failure()?.errorText);
});dumpio, console forwarding, and protocol diagnostics help identify a page or browser failure; they are not memory optimizers. Log job ID, URL, context ID, start time, end time, and cleanup result so a memory graph can be matched to actual work.
Treat concurrency as a hypothesis
More simultaneous pages generally means more live renderer state, but the sources do not provide a universal memory-per-page value or a safe concurrency number. If you suspect concurrency, run a controlled comparison: hold the URL mix constant, cap active jobs, record host and process memory, and compare task latency and failure rate. Keep the setting only if reliability and memory improve for your workload.
The same rule applies to page reuse, launch flags, and periodic browser restarts. A restart interval is not universally correct. If you add recycling, document the trigger (for example, repeated task failures or a measured resident-set trend), drain active jobs, close contexts, then close the browser and launch a replacement.
4. Monitor the Droplet and alert on sustained pressure
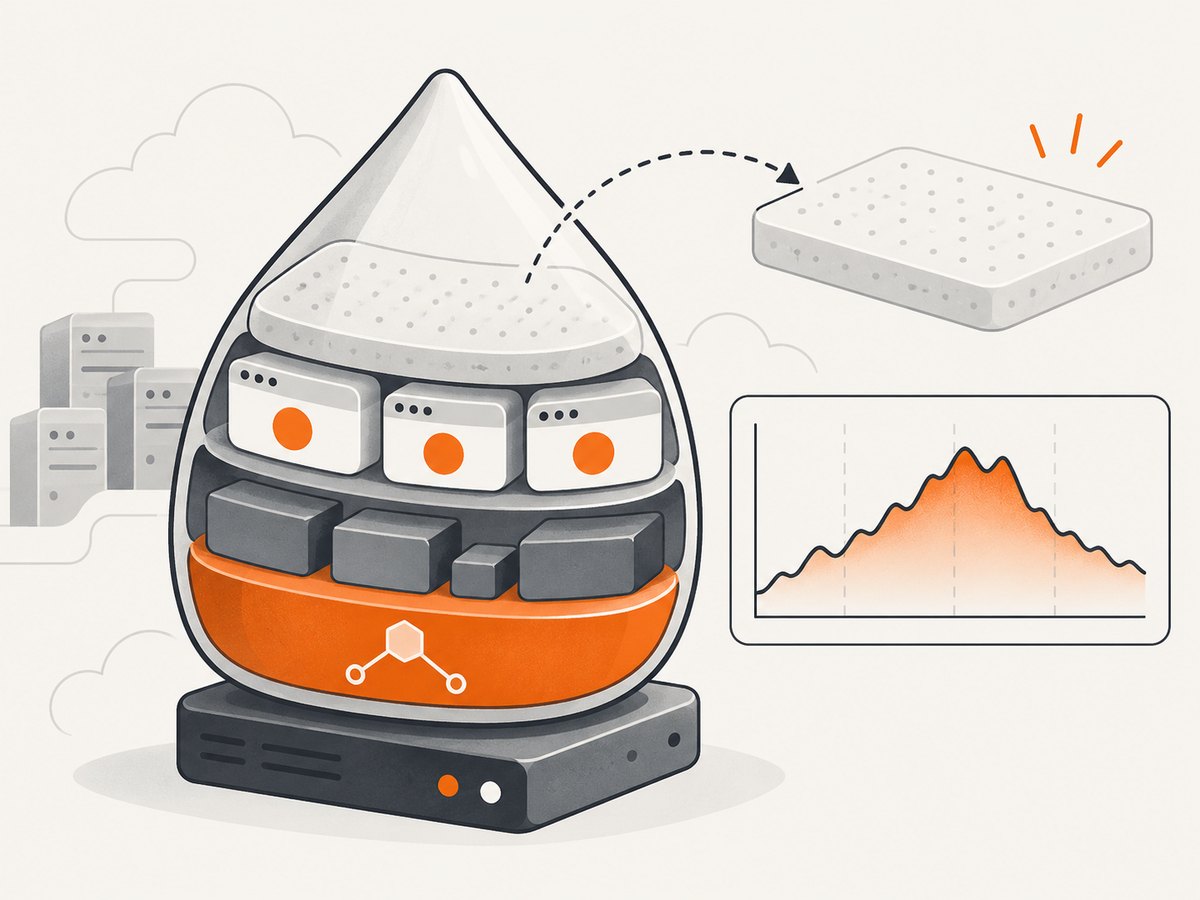
DigitalOcean Monitoring is opt-in and uses its metrics agent for system measurements, including memory. Enable the agent, verify that graphs have data, and create a memory alert with a duration that matches your response time. The September 2026 Monitoring Quickstart suggests starting at 70% — DigitalOcean, 2026 for CPU, memory, or disk alerts. That is a starting configuration, not a universal safe limit or a study result.
A practical alert workflow
- Alert on sustained usage, not a brief navigation spike.
- When alerted, identify the largest processes and correlate them with active jobs.
- Check whether cached memory explains the dashboard difference.
- Inspect cleanup logs for pages, contexts, handles, and browser shutdowns.
- Reduce workload concurrency or fix ownership if the evidence points to the application.
Keep an incident record with timestamp, Droplet size, deployment version, active jobs, process RSS, and alert duration. This makes a resize decision evidence-based.
5. Decide when resizing is appropriate
DigitalOcean’s support guidance for high RAM or CPU recommends identifying processes consuming resources. If high use persists under normal workloads after lifecycle corrections, resizing the Droplet is an available option. Resizing adds capacity; it does not prove that a retained page, handle, or orphaned browser was fixed.
Before resizing, answer:
- Does memory return to a stable range when traffic stops?
- Do browser processes disappear after the worker exits?
- Does each job close its page or context on errors?
- Are other services competing for RAM?
- Is the workload’s normal peak now larger than the Droplet’s capacity?
Keep swap and disk behavior in your operational plan, but do not treat swap as a substitute for finding an ownership bug. Browser workloads under pressure can become slow and unreliable before an out-of-memory kill.
6. A complete lifecycle pattern for a long-running worker
import puppeteer from 'puppeteer';

const browser = await puppeteer.launch({ headless: true });

async function capture(url) {
  const context = await browser.createBrowserContext();
  let page;
  try {
    page = await context.newPage();
    await page.goto(url, { waitUntil: 'domcontentloaded', timeout: 30000 });
    return await page.screenshot({ type: 'png' });
  } finally {
    // Context closure releases its pages and isolated storage.
    await context.close().catch(error => console.error('context cleanup failed', error));
  }
}

const queue = ['https://example.com'];
for (const url of queue) {
  try {
    const image = await capture(url);
    console.log(url, image.length);
  } catch (error) {
    console.error('capture failed', url, error);
  }
}

await browser.close();
This pattern makes cleanup task-scoped and keeps browser shutdown at process scope. Add backpressure around the queue so the number of active contexts is an intentional setting rather than an accidental consequence of incoming requests.
7. Troubleshooting common memory symptoms
| Symptom | Likely cause | Fix |
|---|---|---|
| Chromium remains after Node exits | The worker called browser.disconnect() or never closed its browser. |
Use browser.close() for a worker-owned browser, or terminate it through the service that owns it. |
| Memory rises with every job | Pages, contexts, ElementHandles, listeners, or job data remain referenced. | Put cleanup in finally, close contexts, dispose handles, and inspect retained arrays and timers. |
| Memory spikes only on certain sites | The page may create large DOMs, downloads, workers, or long-lived connections. | Log the URL and task phase, reproduce it alone, and enforce navigation and operation timeouts. |
| Dashboard says high memory but processes look small | Different tools account for filesystem cache differently. | Compare DigitalOcean’s used-memory definition with host tools and inspect the trend. |
| Restart appears to fix the issue temporarily | State is accumulating, or traffic is exceeding steady-state capacity. | Measure before and after restart, find the retained resource, and use recycling only as a documented mitigation. |
| Droplet reaches OOM during bursts | Concurrency exceeds available headroom or another service consumes RAM. | Add queue backpressure, inspect all processes, and resize after confirming normal workload demand. |
8. Performance, reliability, and cost notes
- Performance: closing a context has a cost, but keeping unlimited contexts alive trades that cost for retained memory. Measure latency and RSS together.
- Reliability: cleanup must run on navigation errors, timeouts, rejected promises, and termination signals. Log cleanup failures separately from capture failures.
- Version compatibility: Puppeteer guarantees compatibility with its bundled browser. Its supported-browser page changes over time; do not assume every system Chromium build is interchangeable.
- Cost: a larger Droplet raises infrastructure cost. First distinguish a leak from legitimate capacity demand, then compare the cost of lower concurrency, a corrected lifecycle, and a larger plan.
9. Or skip the browser setup
If your application only needs clean website screenshots, ScreenshotNeo handles the browser service for you. It accepts one GET request and returns PNG, JPEG, WebP, or PDF. Before capture it accepts cookie or consent banners and removes more than 60 known consent platforms, newsletter popups, and chat widgets; each cleanup step can be turned off. Bot checks or CAPTCHAs, blank pages, timeouts, failed loads, and cache hits are not billed, and response headers report the page verdict and whether the shot was billed.
Use the ScreenshotNeo API documentation for all options, including full-page lazy-image loading, CSS-selector element capture, dark mode, device presets, retina scale, PDF paper and page ranges, custom CSS and JavaScript, clicks, waits, blocking, headers, cookies, user agents, authorization, timezone, geolocation, transparent backgrounds, resizing, TTL caching, signed links, async webhooks, bulk capture, usage, and OpenAPI.
cURL
curl -G "https://api.screenshotneo.com/v1/shot" -d access_key=YOUR_API_KEY --data-urlencode url=https://stripe.com -o shot.webpPython
import requests
r = requests.get("https://api.screenshotneo.com/v1/shot", params={"access_key": "YOUR_API_KEY", "url": "https://stripe.com"}, timeout=90)
open("shot.webp", "wb").write(r.content)
Node.js
const q = new URLSearchParams({ access_key: 'YOUR_API_KEY', url: 'https://stripe.com' });
const res = await fetch(`https://api.screenshotneo.com/v1/shot?${q}`);
An MCP server also exposes take_screenshot, get_page_info, and capture_pdf to Claude, Cursor, and other MCP clients. The Free plan includes 1,000 shots per month with no card; paid plans start at $5 for 3,000 shots. Create a free ScreenshotNeo account.
10. FAQ
Should I close the browser after every screenshot?
Close it when the worker owns a short-lived browser. For a long-running worker, keep one browser only if measurements show stable behavior and every task closes its page or context.
Is browser.disconnect() a memory fix?
No. It detaches Puppeteer and leaves the browser process running. Use it only when another component owns that browser.
What memory percentage is safe?
There is no universal threshold. DigitalOcean’s Quickstart suggests 70% as a starting alert threshold; tune duration and response to your workload.
Can a restart schedule replace cleanup?
No. A restart can limit the duration of accumulation, but it can also hide a lifecycle bug. Find and close retained resources first.
When should I resize the Droplet?
After identifying processes and correcting cleanup, resize when sustained normal workload still exceeds available capacity or leaves insufficient headroom for bursts.


