How to Render AmCharts in Puppeteer PDFs with React
Render client-side AmCharts reliably in React PDFs with Puppeteer by waiting for chart readiness, using print CSS, and choosing the right export path.

To render an AmCharts chart in a Puppeteer PDF, render the React report in a real browser, wait for your application to signal that the chart and its data are ready, then call page.pdf(). Puppeteer prints the page using the print CSS media type, so your report needs print-aware styles. The exact chart setup depends on whether the project uses amCharts 5 or the legacy amCharts 3 React wrapper; their APIs should not be mixed.
This guide shows a complete React and Puppeteer implementation, explains readiness signaling, print layout, PDF options, version differences, chart-only alternatives, failure modes, and production concerns.
1. Choose the AmCharts integration before writing PDF code
Check package.json, imports, and existing chart components first. Current amCharts 5 uses the official @amcharts/amcharts5 package and ES module imports. Its core module must be imported before modules such as XY charts, percent charts, themes, or animated themes. See the amCharts 5 getting-started documentation.
The official React wrapper found for amCharts 3 is a separate integration. @amcharts/amcharts3-react accepts an options object with the same configuration shape used by AmCharts.makeChart. Its release history records React 17 and React 18 support in version 3.1.1. Treat this as a legacy-version path; do not use its configuration examples as amCharts 5 code. The wrapper documentation is available in its official repository.
| Project situation | Use | Key decision |
|---|---|---|
| New or current chart code | amCharts 5 | Import @amcharts/amcharts5 core before chart modules. |
| Existing legacy React chart | @amcharts/amcharts3-react |
Pass the existing AmCharts.makeChart-style object through options. |
| Whole report with text, tables, and charts | Puppeteer Page.pdf() |
Wait for report readiness and style the print media layout. |
| Chart-only PDF | amCharts 3 export plugin | Its PDF path documents pdfmake and vfs_fonts.js dependencies. |
2. Expose an explicit chart-ready signal in React
Do not make Puppeteer guess how long a chart takes. The reviewed documentation does not define one universal ready event or a safe fixed delay for every AmCharts version, data source, browser, and application. Have the report set a deterministic DOM marker after data has arrived and the chart has been created.

The marker can be a simple attribute on the report root. Set it only after the chart component has completed its own initialization. If data is loaded asynchronously, set it after the fetch has succeeded and the chart has received the data. If your application can encounter an error, expose a separate error marker so the PDF job fails clearly instead of producing a blank page.
import React, { useEffect, useRef, useState } from 'react';
import * as am5 from '@amcharts/amcharts5';
import * as am5xy from '@amcharts/amcharts5/xy';
import am5themes_Animated from '@amcharts/amcharts5/themes/Animated';

export default function SalesReport() {
  const chartNode = useRef(null);
  const [state, setState] = useState('loading');

  useEffect(() => {
    let root;
    let cancelled = false;

    async function renderChart() {
      try {
        const response = await fetch('/api/sales');
        if (!response.ok) throw new Error(`Sales request failed: ${response.status}`);
        const data = await response.json();
        if (cancelled || !chartNode.current) return;

        root = am5.Root.new(chartNode.current);
        root.setThemes([am5themes_Animated.new(root)]);
        const chart = root.container.children.push(
          am5xy.XYChart.new(root, { panX: false, panY: false })
        );
        const xAxis = chart.xAxes.push(am5xy.CategoryAxis.new(root, {
          categoryField: 'month',
          renderer: am5xy.AxisRendererX.new(root, {})
        }));
        const yAxis = chart.yAxes.push(am5xy.ValueAxis.new(root, {
          renderer: am5xy.AxisRendererY.new(root, {})
        }));
        const series = chart.series.push(am5xy.ColumnSeries.new(root, {
          name: 'Sales',
          xAxis,
          yAxis,
          valueYField: 'amount',
          categoryXField: 'month'
        }));
        xAxis.data.setAll(data);
        series.data.setAll(data);

        // The report owns this readiness contract.
        document.documentElement.dataset.chartReady = 'true';
        setState('ready');
      } catch (error) {
        document.documentElement.dataset.chartError = error.message;
        setState('error');
      }
    }

    renderChart();
    return () => {
      cancelled = true;
      if (root) root.dispose();
    };
  }, []);

  return (
    <main className="report" data-report-state={state}>
      <h1>Monthly sales</h1>
      {state === 'loading' && <p className="loading">Loading chart…</p>}
      {state === 'error' && <p className="error">The chart could not be loaded.</p>}
      <div ref={chartNode} className="chart" aria-label="Monthly sales chart" />
    </main>
  );
}
3. Render the React report and create the PDF with Puppeteer
Puppeteer’s documented PDF API is Page.pdf(). It generates the PDF using print CSS media, which means styles under @media print and print-specific color behavior affect the result. The API reference is at pptr.dev/api/puppeteer.page.pdf, and the PDF guide is at pptr.dev/guides/pdf-generation.
The following Node.js script assumes the React application is already running at http://localhost:3000. It waits for the explicit readiness marker, checks for an application error, and then writes a PDF.
import puppeteer from 'puppeteer';

const browser = await puppeteer.launch({
  headless: true,
  args: ['--no-sandbox', '--disable-setuid-sandbox']
});

try {
  const page = await browser.newPage();
  await page.setViewport({ width: 1440, height: 1000, deviceScaleFactor: 1 });
  await page.emulateMediaType('print');

  await page.goto('http://localhost:3000/reports/sales', {
    waitUntil: 'networkidle0',
    timeout: 60000
  });

  await page.waitForFunction(
    () => document.documentElement.dataset.chartReady === 'true',
    { timeout: 60000 }
  );

  const chartError = await page.evaluate(
    () => document.documentElement.dataset.chartError || null
  );
  if (chartError) throw new Error(`Chart failed: ${chartError}`);

  await page.pdf({
    path: 'sales-report.pdf',
    format: 'A4',
    printBackground: true,
    preferCSSPageSize: true,
    displayHeaderFooter: false,
    margin: { top: '16mm', right: '14mm', bottom: '16mm', left: '14mm' }
  });
} finally {
  await browser.close();
}
networkidle0 helps with page-level requests, but it is not a substitute for the chart-ready marker. A chart can finish after network activity quiets down, and a page can remain busy because of analytics, sockets, or polling even though the chart is ready. Use both only when they match your application.
4. Add print CSS for predictable chart output
Because Puppeteer prints with the print media type, desktop screen styling alone is insufficient. Give the chart a concrete height, prevent important cards from splitting, and preserve colors when your design needs them.
@page {
  size: A4 portrait;
  margin: 16mm 14mm;
}

.chart {
  width: 100%;
  height: 280px;
}

@media print {
  * {
    -webkit-print-color-adjust: exact;
    print-color-adjust: exact;
  }

  body {
    margin: 0;
    background: #fff;
  }

  .loading,
  .screen-only,
  button {
    display: none !important;
  }

  .report-card {
    break-inside: avoid;
    page-break-inside: avoid;
  }

  h1, h2 {
    break-after: avoid;
    page-break-after: avoid;
  }
}
Use preferCSSPageSize when the @page rule should control the physical page size. Otherwise, set Puppeteer’s format, width, or height explicitly. For landscape reports, use landscape: true. Set printBackground: true when chart fills, card backgrounds, or bands are meaningful. Header and footer templates are available through headerTemplate and footerTemplate when displayHeaderFooter is enabled.
5. Complete amCharts 3 React path
If the application uses the legacy wrapper, retain its documented configuration model rather than rewriting it as amCharts 5. The wrapper passes the object through the same general configuration shape as AmCharts.makeChart.
import React from 'react';
import AmCharts from '@amcharts/amcharts3-react';

const options = {
  type: 'serial',
  dataProvider: [
    { month: 'Jan', amount: 120 },
    { month: 'Feb', amount: 180 }
  ],
  categoryField: 'month',
  categoryAxis: { gridPosition: 'start' },
  graphs: [{
    type: 'column',
    valueField: 'amount',
    fillAlphas: 0.8
  }],
  listeners: [{
    event: 'rendered',
    method: function () {
      document.documentElement.dataset.chartReady = 'true';
    }
  }]
};

export default function LegacyReport() {
  return <AmCharts.React options={options} />;
}
Confirm the wrapper version and its event behavior in the application you maintain. The readiness contract remains yours to define; do not assume that an event from one major version exists in another.
6. Chart-only PDF versus printing the whole report
Use Puppeteer when the deliverable includes the React page around the chart: headings, filters, explanatory text, tables, multiple charts, and page-level layout. It captures what the browser rendered and applies print CSS.
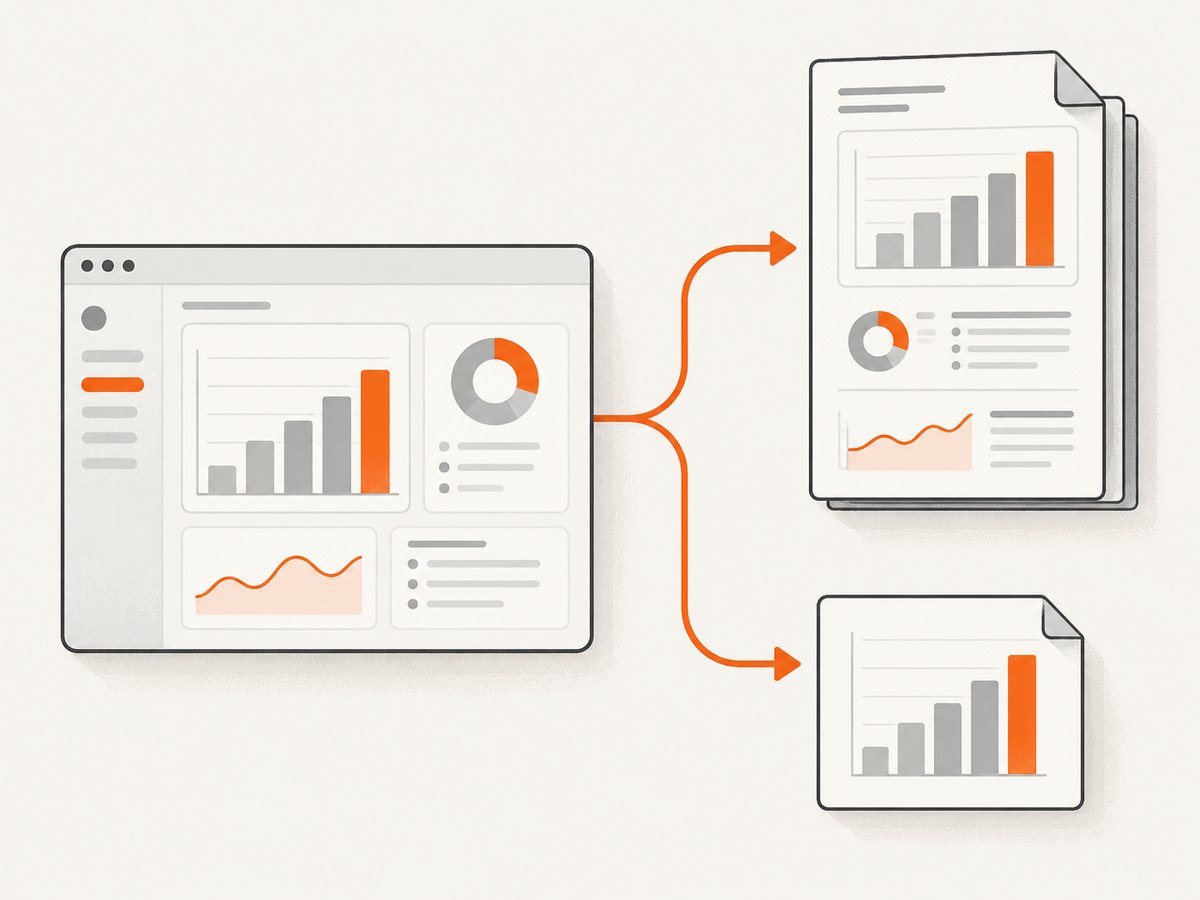
The amCharts 3 export plugin is a separate chart-level route. Its documentation lists PDF export and dependencies including pdfmake and vfs_fonts.js. Choose it when the required artifact is only the chart and you want the chart library’s export controls. It does not replace Puppeteer’s page printing for a complete report.
7. Troubleshooting checklist
| Symptom | Likely cause | Fix |
|---|---|---|
| Blank chart area | PDF capture runs before browser-side initialization or data loading. | Set a readiness marker after chart creation and wait for it with page.waitForFunction. |
| Timeout waiting for readiness | Fetch failed, selector is wrong, the chart component never mounted, or an error path does not resolve. | Inspect page console and network logs, expose a chart error marker, and make every failure path observable. |
| Wrong API or runtime errors | amCharts 3 wrapper code was combined with amCharts 5 imports, or vice versa. | Check the installed major version and follow that version’s official setup. |
| Colors disappear | Print color adjustment is disabled or backgrounds are not requested. | Use printBackground: true and print color adjustment CSS where required. |
| Chart is clipped | The chart has no fixed height, or its container changes size after capture. | Set explicit dimensions, wait for layout completion, and avoid capturing while a responsive transition is active. |
| Unexpected page breaks | Screen layout does not define print breaks. | Use break-inside: avoid, break-before, and an @page rule. |
| PDF has only the chart but the report is missing | A chart export API was used instead of page printing. | Use Page.pdf() for the complete React report. |
| Fonts or assets are missing | Assets are inaccessible from the browser process or load after the readiness check. | Use absolute reachable URLs, wait for required assets, and verify the same runtime environment used in production. |
8. Reliability, performance, and cost considerations
Reliability
Make readiness explicit, return useful errors, and close the browser even when capture fails. Keep the browser process lifecycle bounded; one stuck page should not hold a job forever. Validate the generated PDF in the same container or server environment that runs production captures because fonts, browser versions, network access, and viewport metrics affect output.
Performance
Reuse a browser process for a controlled queue of jobs, but create a fresh page for each report so cookies, DOM state, and chart instances do not leak. Avoid arbitrary long sleeps. A readiness condition usually finishes sooner and is more predictable than a conservative fixed delay. Large datasets, animations, external fonts, and image-heavy pages increase rendering time; disable nonessential animation for print or wait until the final chart state is stable.
Cost
Puppeteer itself is open-source software, but your PDF worker still consumes CPU, memory, storage, and network resources. Account for browser startup, concurrent pages, retries, and asset delivery when sizing infrastructure. Chart-only export can use fewer browser resources, while full-page PDFs require a browser-rendered report.
9. Or skip the browser setup
ScreenshotNeo provides a website screenshot API and MCP server. It is useful when you need a rendered page image or PDF without maintaining Puppeteer workers. See the ScreenshotNeo API documentation.
cURL:
curl -G "https://api.screenshotneo.com/v1/shot" -d access_key=YOUR_API_KEY --data-urlencode url=https://stripe.com -o shot.webpPython:
import requests
r = requests.get("https://api.screenshotneo.com/v1/shot", params={"access_key": "YOUR_API_KEY", "url": "https://stripe.com"}, timeout=90)
open("shot.webp", "wb").write(r.content)
Node.js:
const q = new URLSearchParams({ access_key: 'YOUR_API_KEY', url: 'https://stripe.com' });
const res = await fetch(`https://api.screenshotneo.com/v1/shot?${q}`);
Cookie banners, newsletter popups, and chat widgets are removed before the shot. Bot checks, blank pages, failed loads, timeouts, and cache hits are never billed, and response headers identify the page verdict and billing result. The MCP server includes take_screenshot, get_page_info, and capture_pdf tools for Claude, Cursor, and other MCP clients. You can use full-page capture, element selectors, custom CSS and JavaScript, waits, headers, cookies, user agents, geolocation, PDF settings, caching, signed links, asynchronous jobs, bulk capture, and other options on every plan.
The Free plan includes 1,000 screenshots per month with no card. Paid plans start at $5 for 3,000 shots, and yearly billing gives two months free. Create a free ScreenshotNeo account.
10. FAQ
Does Puppeteer wait for AmCharts automatically?
No. Page navigation readiness and chart readiness are separate concerns. Expose and wait for an application-specific signal.
Which AmCharts version should new React code use?
Use the current amCharts 5 package and its module imports. Keep amCharts 3 wrapper code isolated when maintaining a legacy application.
Can I use a fixed timeout instead of a readiness marker?
You can, but a fixed delay has no universal safe value across data, browsers, and environments. A readiness contract is easier to reason about and troubleshoot.
How do I export just the chart?
For amCharts 3, consider the export plugin and its documented PDF dependencies. For a complete React report, use Puppeteer page printing.
Why does my PDF look different from the browser tab?
Page.pdf() uses print CSS media. Review @media print, @page, margins, background printing, viewport size, and font availability.


