How to Test an MCP Server with MCP Testing Tools
Use MCP Inspector, automated checks, unit tests, schema snapshots, model evaluations, and client compatibility tests to verify an MCP server.
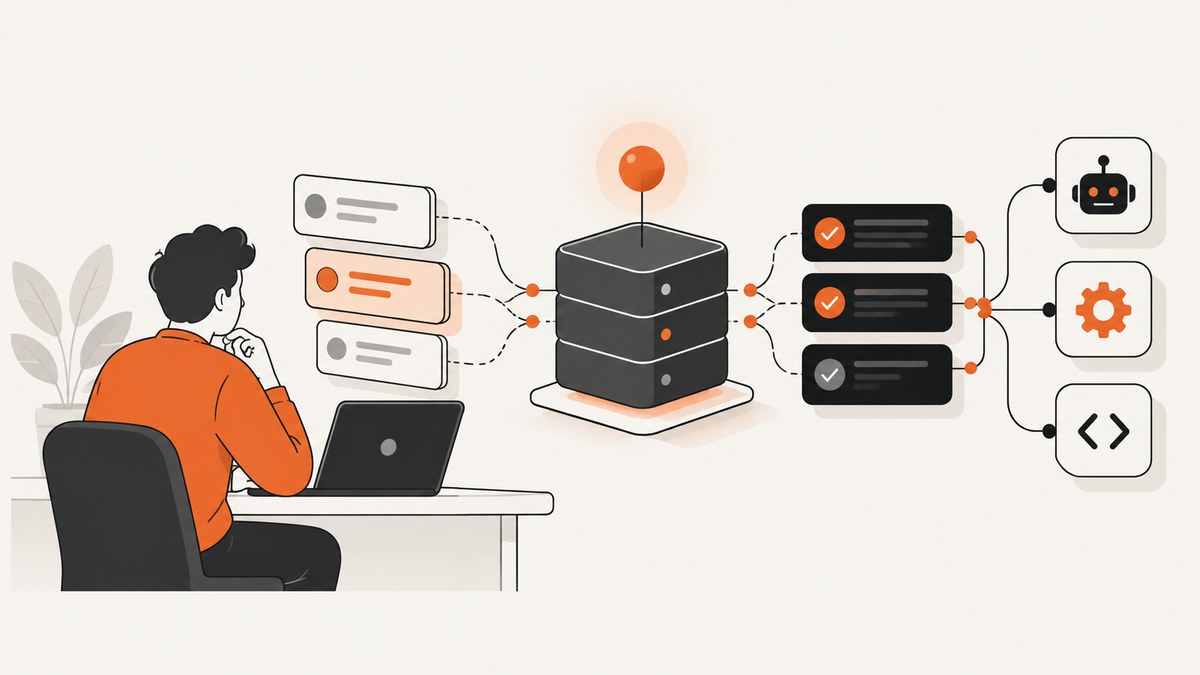
Short answer: test an MCP server in layers. Start with the official MCP Inspector to prove startup, transport, capability negotiation, tools, resources, prompts, logs, and errors. Then automate protocol smoke checks, unit-test handlers, snapshot definitions, evaluate realistic model tasks, and verify the exact host client and protocol era you will ship.
The MCP Inspector documentation calls it “the reference developer tool for testing and debugging MCP servers.” The current package requires Node.js 22.19.0 or newer and runs through npx.
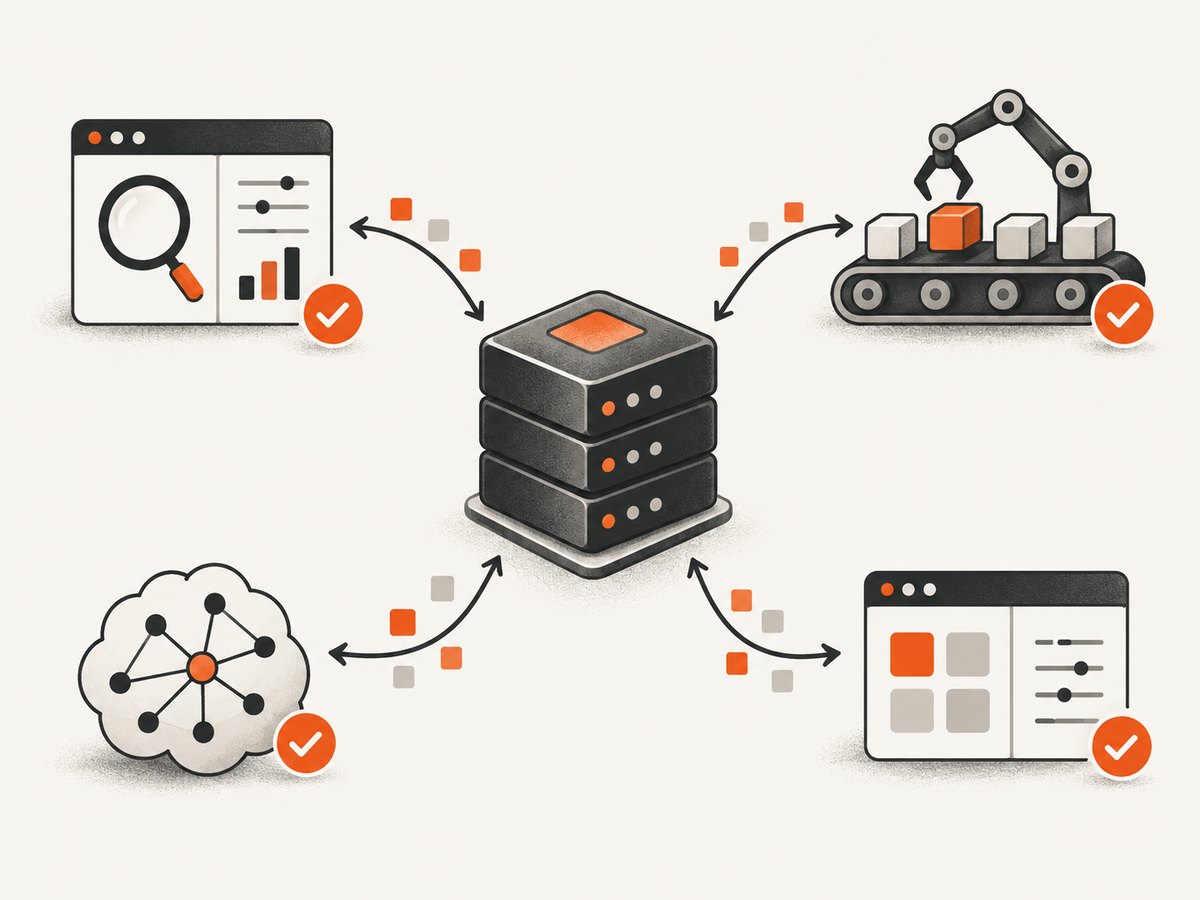
1. Choose the test layers
| Layer | Catches | Best tool | Speed |
|---|---|---|---|
| Startup and protocol | Bad command, transport mismatch, failed negotiation, malformed responses | Inspector web UI, CLI, or TUI | Fast |
| Tool logic | Validation, upstream requests, result and error mapping | SDK in-memory transport and unit tests | Very fast |
| Definitions | Tool name, description, schema, or capability drift | tools/list snapshots and strict checks |
Fast |
| Model behavior | Whether a model selects the right tool and supplies useful arguments | Task evaluations with a real client/model | Slower |
| Client compatibility | Host configuration, OAuth, limits, protocol-era differences | The target host plus Inspector | Slowest |
A passing connection proves only that a session can be established. It does not prove that a model can discover your tools, that invalid input is safe, or that a particular host implements the same transport and protocol era.
2. Install prerequisites and run Inspector
Check Node and start the web Inspector
node --version
# Use Node 22.19.0 or newer
npx @modelcontextprotocol/inspector node path/to/server/index.js
Read the server README first: launch arguments, environment variables, working directory, and authentication are server-specific. The command opens Inspector’s web interface, where you can connect, inspect logs and notifications, list capabilities, and call operations.
Use a remote HTTP server
npx @modelcontextprotocol/inspector --server-url https://api.example.com/mcp --transport httpUse the transport and authentication expected by the deployment. A server that speaks stdio cannot be tested with the HTTP option, and a protected endpoint may need credentials configured in the server or host environment.
Use the terminal UI or CLI
npx @modelcontextprotocol/inspector --tui node path/to/server/index.js
npx @modelcontextprotocol/inspector --cli node path/to/server/index.js --method tools/list
The CLI is suitable for smoke checks and CI because it performs a method and exits. The Inspector documentation also shows selecting a tool, passing JSON arguments, and emitting JSON; check the installed package help for the exact flags in your version.
3. Verify the contract before calling tools
- Connect with the production transport. Confirm the process starts without interactive prompts, negotiates capabilities, and remains alive after initialization.
- Inspect capabilities. Record whether the server exposes tools, resources, prompts, logging, or other features. Missing capability can be a version or protocol-era mismatch rather than an application error.
- Review every definition. Names should be stable; descriptions should explain when a tool is appropriate; input schemas should identify required fields, types, enums, bounds, and defaults. Treat descriptions as part of the model-facing API.
- Exercise ordinary paths. Call each tool with realistic, valid arguments. For resources, list and read representative URIs; for prompts, supply normal arguments and inspect the rendered messages.
- Watch messages. Inspect server logs, progress, notifications, and structured error content while calls run.
4. Test failure paths deliberately
| Case | Expected result |
|---|---|
| Missing required field | A validation error identifies the field; the process stays alive. |
| Wrong JSON type | A clear schema or argument error, without a stack trace leaking secrets. |
| Unknown identifier or URI | A predictable not-found response and no corrupted state. |
| Upstream timeout or 5xx | A bounded, intelligible tool error; retries are safe or explicitly absent. |
| Concurrent calls | Responses remain matched to request IDs and shared state is consistent. |
| Malformed or oversized input | Rejected before expensive work; memory and execution remain bounded. |
Also test cancellation where your client supports it, repeated calls, empty results, partial upstream data, and authentication failure. Expected failures should be returned as protocol-level errors or tool results according to your SDK’s conventions, rather than crashing the server.
5. Automate a CLI smoke check
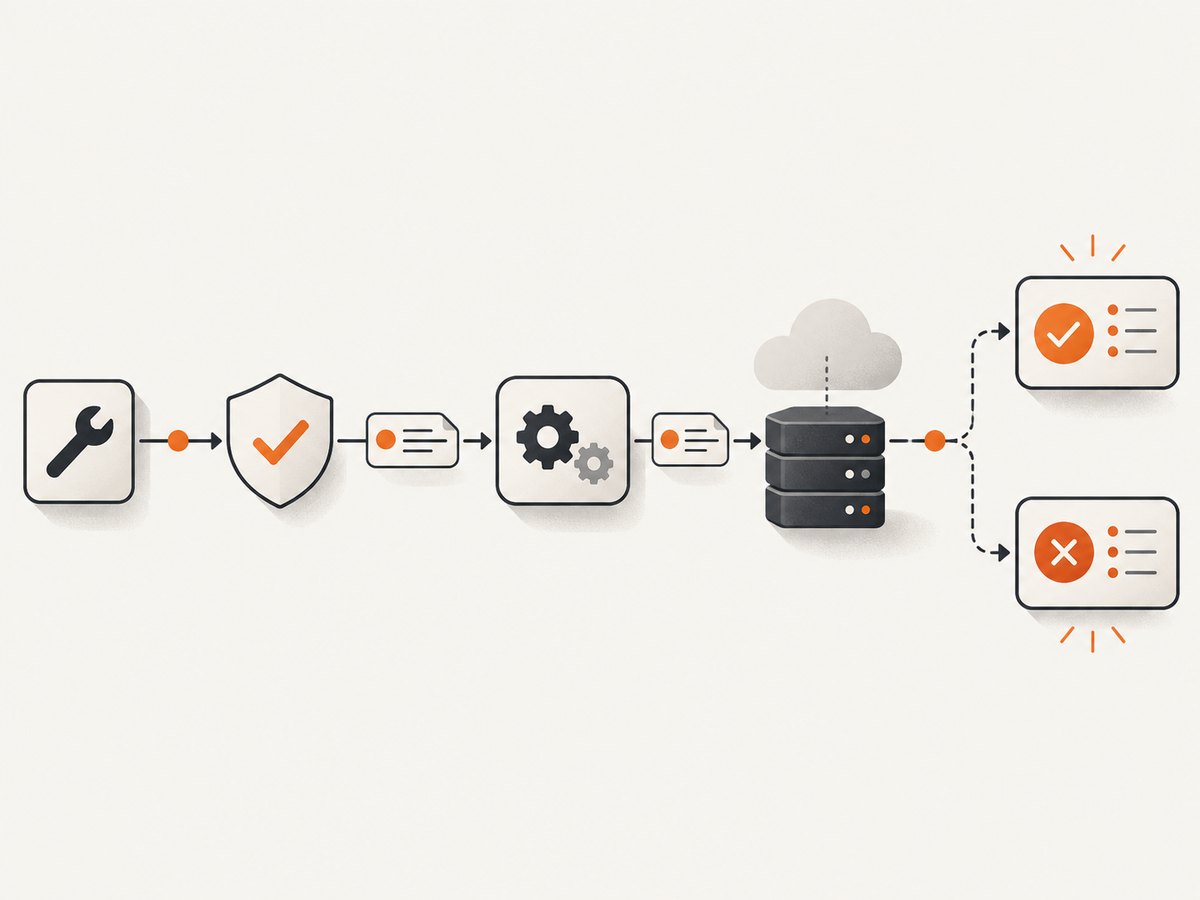
Keep one command that starts the same artifact used in deployment and verifies discovery. Fail CI when the command exits non-zero, emits invalid JSON, or no longer contains a required tool.
#!/usr/bin/env bash
set -euo pipefail
out=$(mktemp)
trap 'rm -f "$out"' EXIT
npx @modelcontextprotocol/inspector --cli node dist/server.js --method tools/list --output json >"$out"
node -e 'const x=require(process.argv[1]); if (!Array.isArray(x.tools)) process.exit(2); for (const n of ["search","fetch"]) if (!x.tools.some(t=>t.name===n)) process.exit(3)' "$out"
Flag names can vary by Inspector release; run npx @modelcontextprotocol/inspector --help and pin the package version in CI when reproducibility matters.
6. Unit-test handlers separately
Protocol tests are slow and opaque for business logic. Use the official TypeScript SDK’s in-memory transport, or the equivalent in your SDK, to connect a test client directly to the server in one process. Cover argument validation, request construction, success mapping, timeout handling, retries, and redaction. Keep these tests deterministic with a fake upstream.
// Adapt names to the SDK version used by your server.
const [clientTransport, serverTransport] = InMemoryTransport.createLinkedPair();
await server.connect(serverTransport);
await client.connect(clientTransport);
const result = await client.callTool({ name: 'search', arguments: { query: 'mcp' } });
expect(result.isError).toBe(false);
expect(result.content).toEqual(expect.any(Array));
For HTTP integration, run a real server and exercise the real transport. Inspector’s project test suite is a useful design reference: its fixtures run in-process for HTTP paths and as real stdio subprocesses for CLI and stdio integration paths.
7. Snapshot schemas and definitions
Save normalized tools/list output in version control. Review changes to names, descriptions, required fields, enum values, and output annotations as API changes. Add strict schema validation in pull requests when your target clients reject advanced JSON Schema constructs. A schema can be valid JSON Schema and still be unusable by a host with a narrower implementation.
npx @modelcontextprotocol/inspector --cli node dist/server.js --method tools/list --output json > snapshots/tools-list.jsonNormalize ordering and remove volatile fields before diffing. Require explicit review for breaking changes; update model evaluations when descriptions or examples change.
8. Evaluate real model use
Write tasks that resemble production requests and assert the outcome, not a hidden chain of thought. Measure whether the model discovers the server, selects the intended tool, supplies valid arguments, handles a tool error, and reaches the requested result. Run the set before release and after changing descriptions, schemas, authentication, or protocol versions. Unit tests cannot establish model selection quality.
9. Test transport, client, and protocol era
Repeat the checks over the transport you deploy: stdio subprocess, HTTP, or another supported mode. Then connect from each important host and verify its configuration format, OAuth flow, timeouts, message limits, and cancellation behavior. Inspector negotiation covers legacy and modern protocol eras, including the 2026-07-28 era. Test the era your server supports and the eras used by target clients; a wrong era can look like a missing capability. Pin the mode while diagnosing a version-specific failure, and verify current SDK and Inspector versions in your environment.
10. Python and Node.js wrappers for repeatable checks
Python: run discovery in CI
import json
import subprocess

cmd = ['npx', '@modelcontextprotocol/inspector', '--cli',
       'node', 'dist/server.js', '--method', 'tools/list', '--output', 'json']
r = subprocess.run(cmd, check=False, text=True, capture_output=True, timeout=90)
if r.returncode:
    raise SystemExit(r.stderr or 'Inspector failed')
data = json.loads(r.stdout)
names = {tool['name'] for tool in data.get('tools', [])}
required = {'search', 'fetch'}
missing = required - names
if missing:
    raise SystemExit(f'Missing tools: {sorted(missing)}')
print('MCP discovery OK')
Node.js: assert a tool call
import { spawn } from 'node:child_process';

const args = ['@modelcontextprotocol/inspector', '--cli', 'node', 'dist/server.js',
  '--method', 'tools/call', '--tool', 'search',
  '--arguments', JSON.stringify({ query: 'mcp' }), '--output', 'json'];
const p = spawn('npx', args, { stdio: ['ignore', 'pipe', 'pipe'] });
let out = '', err = '';
p.stdout.on('data', b => out += b);
p.stderr.on('data', b => err += b);
p.on('close', code => {
  if (code !== 0) process.exit((console.error(err), code || 1));
  const result = JSON.parse(out);
  if (result.isError) process.exit(2);
  console.log('MCP tool call OK');
});
Inspector option names for tool selection and arguments differ across releases; confirm them with its help output and pin the version used by your wrapper.
11. Troubleshooting checklist
| Symptom | Likely cause | Fix |
|---|---|---|
| Process exits immediately | Wrong path, missing environment variable, or startup exception | Run the launch command directly, check stderr, working directory, and secrets. |
| Inspector cannot connect | Transport flag does not match the server | Use stdio for a subprocess; use --server-url and the documented HTTP transport for a remote endpoint. |
| No tools appear | Capability negotiation or protocol-era mismatch | Inspect initialize logs, pin the protocol mode, and compare SDK versions. |
| Tool is visible but model never chooses it | Ambiguous description or schema | State purpose, required inputs, limits, and a short positive example; rerun model evaluations. |
| Valid call returns an error | Wrong argument shape, auth, upstream failure, or timeout | Replay the exact JSON, inspect server logs, validate credentials, and add bounded retries only where safe. |
| Concurrent calls cross results | Shared mutable state or incorrect request-ID mapping | Run parallel tests, isolate per-request state, and assert response IDs. |
| CI hangs | Server or Inspector is waiting for stdin or a child process | Use non-interactive flags, close pipes, set a timeout, and terminate the subprocess on failure. |
| Schema works in Inspector but fails in a host | Host supports a narrower schema subset | Run host-specific validation and simplify unsupported constructs. |
12. Performance, reliability, and cost
- Keep unit tests in memory and reserve subprocess and remote tests for transport coverage.
- Use one discovery smoke test per build, then parallelize independent tool cases where the server is concurrency-safe.
- Set explicit client, upstream, and CI timeouts. Test cancellation and cleanup so a hung call cannot exhaust workers.
- Cache immutable fixtures, but do not hide authentication, rate-limit, or cold-start behavior behind a cache.
- Run a small model evaluation set on every definition change and a larger set before release.
- For remote services, budget requests for ordinary, invalid, timeout, and retry paths; do not treat a successful HTTP connection as proof of a successful tool operation.
Or skip the browser setup
If your MCP workflow needs screenshots of web pages, you can call ScreenshotNeo directly instead of maintaining browser launch code. Its API accepts one GET request and returns PNG, JPEG, WebP, or PDF. Cookie and consent banners, newsletter popups, and chat widgets are removed before capture; bot checks, blank pages, timeouts, failed loads, and cache hits are not billed, and response headers identify the page verdict and billing result. ScreenshotNeo also provides an MCP server with take_screenshot, get_page_info, and capture_pdf for AI clients.
See the ScreenshotNeo API docs for all options.
curl -G 'https://api.screenshotneo.com/v1/shot' -d access_key=YOUR_API_KEY --data-urlencode url=https://stripe.com -o shot.webpimport requests
r = requests.get('https://api.screenshotneo.com/v1/shot', params={'access_key': 'YOUR_API_KEY', 'url': 'https://stripe.com'}, timeout=90)
open('shot.webp', 'wb').write(r.content)const q = new URLSearchParams({ access_key: 'YOUR_API_KEY', url: 'https://stripe.com' });
const res = await fetch(`https://api.screenshotneo.com/v1/shot?${q}`);There are 1,000 screenshots per month free with no card; paid plans start at $5 for 3,000. Create a free ScreenshotNeo account.
FAQ
How do I test an MCP server from the command line?
Run Inspector with --cli, the server launch command, and a method such as tools/list. Put that command in CI and assert required definitions.
Does Inspector replace unit tests?
No. It proves a real protocol session; in-memory SDK tests are faster for handler logic and error mapping.
Should I test both stdio and HTTP?
Yes when both are supported or used by clients. The same tool can behave differently when framing, authentication, timeouts, and process lifetime change.
What is the most valuable regression snapshot?
A normalized tools/list snapshot containing names, descriptions, required fields, types, and enums, reviewed like any public API change.