6 Tools for Testing Packet Loss
Use ping, MTR, iPerf3, Wireshark, PathPing and Pktmon to measure, localize and prove packet loss.
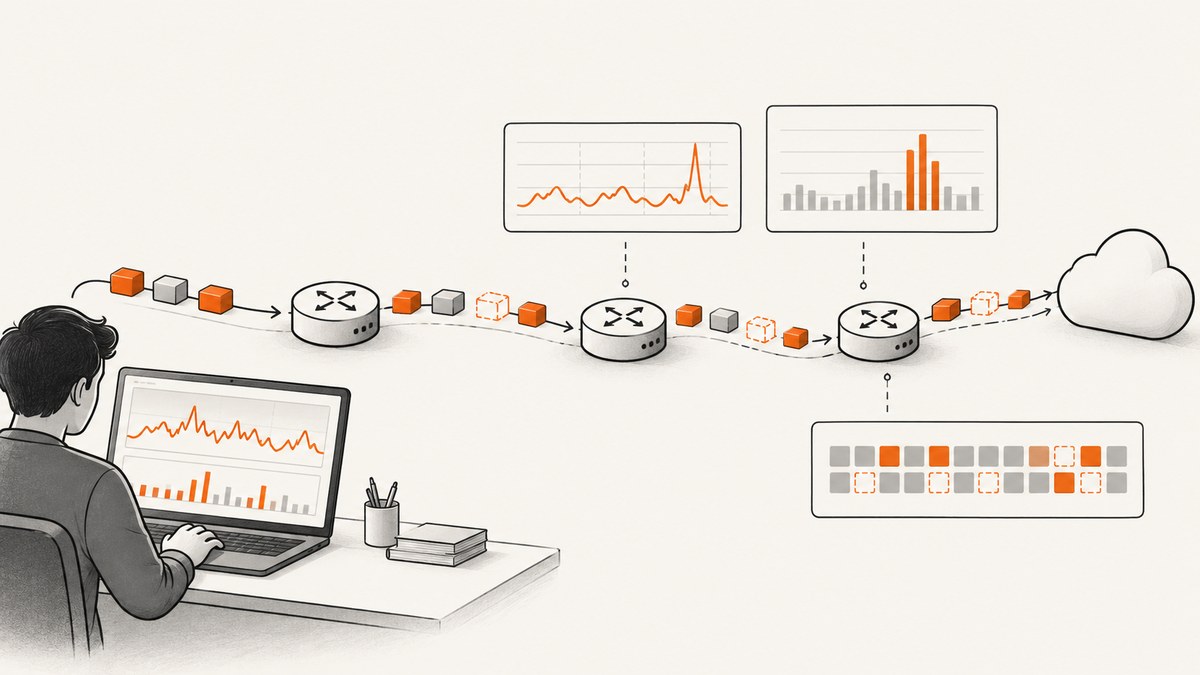
Packet loss means packets sent by one endpoint do not arrive at the other. To test it properly, start with a repeatable ping baseline, localize symptoms with traceroute or PathPing, observe the route over time with MTR, create controlled load with iPerf3, inspect packet evidence in Wireshark or TShark, and use Windows Pktmon when you need to attribute drops inside a Windows host.
No single tool answers every question. Ping measures end-to-end reachability. Traceroute and MTR show where symptoms appear along a path. iPerf3 measures loss under traffic you control. Wireshark proves what happened at the packet level. Pktmon helps identify local Windows causes.
Choose the right packet-loss tool
| Tool | Scope | Traffic | Best use | Main limitation |
|---|---|---|---|---|
| Ping | End to end | ICMP | Fast baseline and percentage loss | Does not localize the failing segment |
| Traceroute / PathPing | Hop by hop | ICMP, UDP or TCP probes, depending on implementation | Finding the first suspicious hop | Routers may filter or rate-limit probes |
| MTR | Repeated hop by hop | ICMP or UDP probes | Watching loss and latency over time | Intermediate replies are not proof of transit loss |
| iPerf3 | Between two endpoints you control | TCP or UDP | Controlled load, loss and jitter | Requires a server and client |
| Wireshark / TShark | Captured endpoint traffic | Any captured protocol | Retransmissions, sequence evidence and statistics | Needs a suitable capture point |
| Windows Pktmon | Inside a Windows host | Host packet path | Local drop reasons and code locations | Primarily a Windows diagnostic |
1. Ping: establish an end-to-end baseline
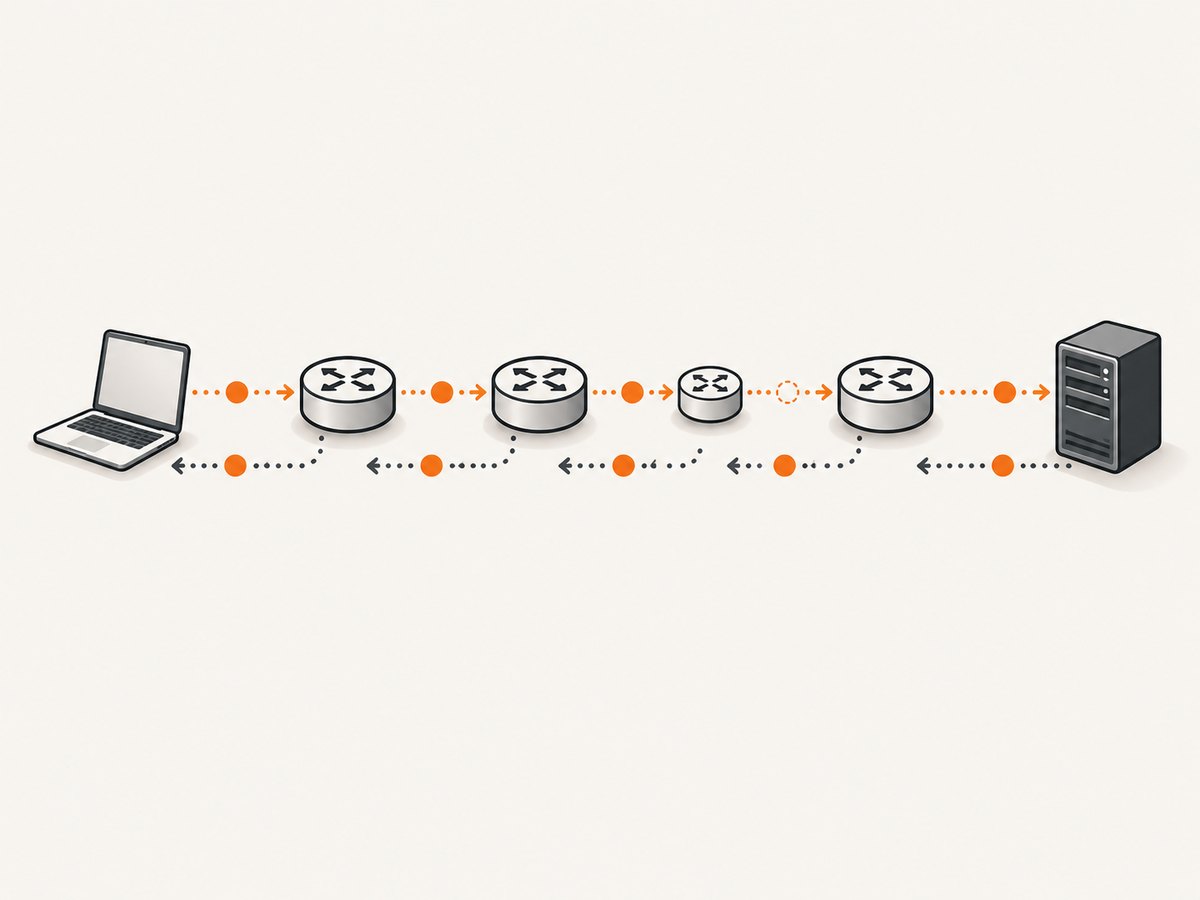
Ping sends ICMP Echo Requests and records replies, round-trip time (RTT) and loss. Run enough probes to make the result repeatable; a single timeout is an observation, not a diagnosis.
Linux and macOS
ping -c 100 -i 0.2 example.comWindows
ping -n 100 -w 1000 example.comRecord the destination, start time, count, interval, packet size, minimum/maximum/average RTT and percentage loss. Repeat from the affected host and, if possible, from a second network. A clean result to the gateway but loss to the destination points beyond the local link; loss to the gateway points closer to the host, access point, cable, interface or first router.
Useful options and edge cases
-son Linux/macOS and-lon Windows change payload size. Larger packets can reveal MTU or fragmentation problems.-W(Linux) and-w(Windows) control wait or timeout behavior.- IPv4 and IPv6 can follow different paths. Test both explicitly with
ping -4andping -6where supported. - Some firewalls deprioritize or block ICMP. An ICMP timeout does not automatically mean application traffic is lost.
Use ping as the baseline, then validate suspected loss with a tool that exercises the relevant application protocol or a controlled UDP stream.
2. Traceroute or Windows PathPing: localize the path symptom
Traceroute sends probes with increasing TTL values so routers reveal successive hops. It helps identify where latency or missing replies first appears. On Windows, PathPing combines route tracing with repeated measurements.
Linux
traceroute -n -w 2 -q 5 example.commacOS
traceroute -n -w 2 -q 5 example.comWindows
pathping -4 -q 20 -w 1000 example.comCompare each hop with the final destination. If hop 5 shows 30% missing replies but hop 6 and the destination are clean, hop 5 is probably rate-limiting diagnostic traffic. If loss begins at hop 5 and continues through every later hop, it is more suspicious. A router that does not answer probes can still forward transit packets normally.
What to record
- Whether probes use ICMP, UDP or TCP mode.
- Hop addresses and names, if reverse DNS is enabled.
- Per-hop loss and latency, plus the destination’s final result.
- Several runs at different times, because routing can change.
3. MTR: observe loss and latency repeatedly
MTR (My Traceroute) combines repeated ping-style measurements with route tracing. It is useful when a five-second traceroute misses an intermittent event.
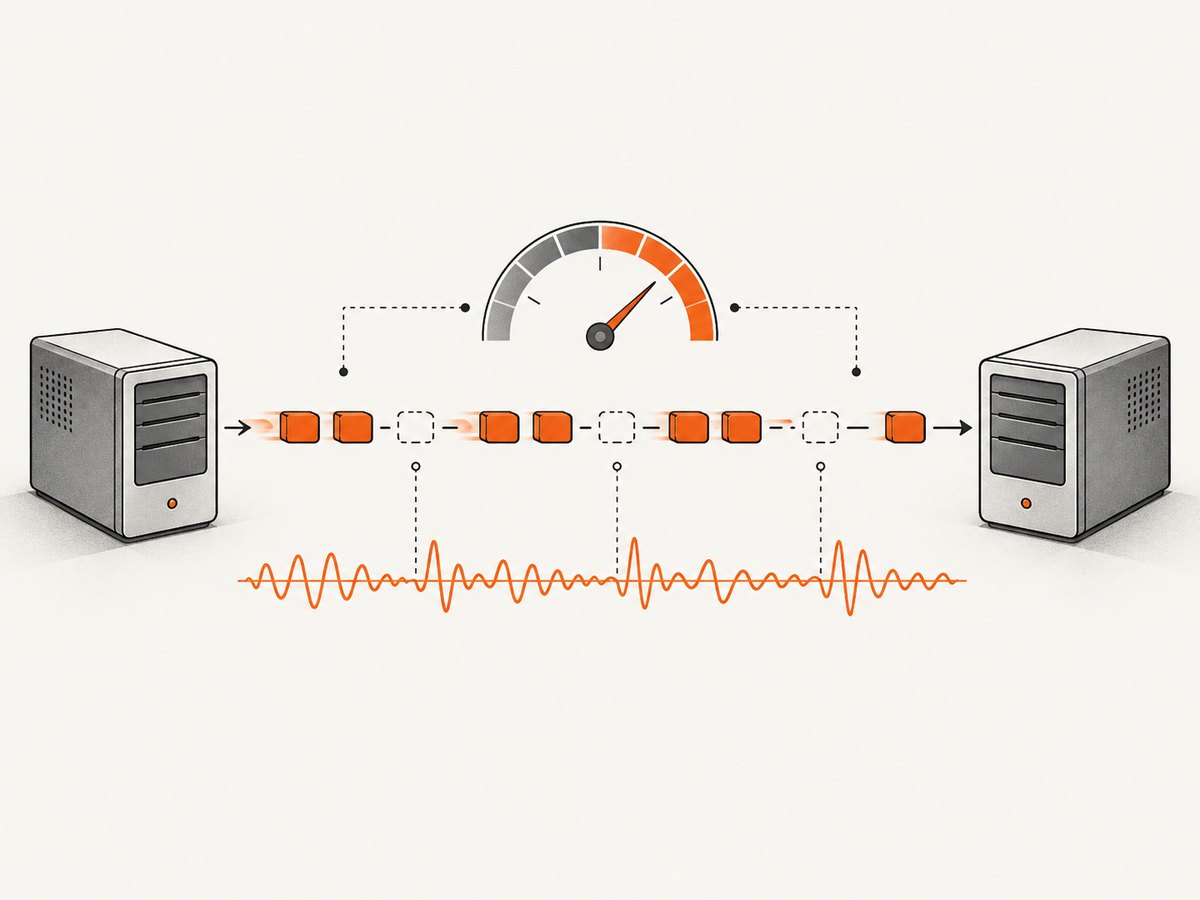
mtr -rwc 100 -i 0.2 example.com-r prints a report, -w uses wide output, -c 100 sends 100 cycles and -i 0.2 spaces probes by 200 milliseconds. Use a longer run when the issue is rare:
mtr -rwc 1000 --report-wide example.comInterpret the final destination first. Intermediate-only loss is often probe filtering. Loss that persists from one hop through the destination is stronger evidence of a path problem. Compare MTR’s loss with ping and, when possible, iPerf3 or a packet capture. MTR is a probe, not an authoritative view of every packet your application sends.
4. iPerf3: measure loss under controlled traffic
iPerf3 requires a server under your control and a client. UDP is the preferred mode when you need a direct loss percentage and jitter measurement; TCP adapts its sending rate and does not report loss directly to the user in the same way.
Start the server
iperf3 -sRun a UDP test
iperf3 -c SERVER_IP -u -b 10M -t 60 -l 1200 -J > udp-test.jsonThis sends 10 Mbit/s for 60 seconds with 1,200-byte datagrams and JSON output. Increase the rate in steps, for example 1 Mbit/s, 10 Mbit/s and 50 Mbit/s, while keeping duration and packet size documented. Loss that appears only above a particular rate suggests congestion or queue exhaustion. Loss at an idle, low rate suggests a different fault.
Important iPerf3 options
-b: target UDP bitrate. Test multiple rates.-t: duration in seconds.-l: UDP payload length. Test below the path MTU before testing larger datagrams.-P: parallel TCP streams when evaluating aggregate TCP capacity.-R: reverse direction, useful when only one direction is affected.-J: machine-readable JSON output.-B: bind to a selected local address or interface.
Run tests in both directions, note the server and client clocks, and avoid saturating a production link without authorization. UDP has no built-in acknowledgment or retransmission, so the receiver’s report is essential.
5. Wireshark and TShark: collect packet-level evidence
Wireshark is a packet analyzer with protocol statistics, while TShark is its command-line counterpart. Capture at the endpoint closest to the suspected loss and inspect retransmissions, sequence behavior, conversations and time-series data. Wireshark’s TShark statistics can calculate ICMP requests, replies, loss, percentage loss and latency statistics.
Capture with TShark
sudo tshark -i eth0 -f "icmp" -a duration:60 -w icmp.pcapngRead ICMP statistics
tshark -r icmp.pcapng -q -z io,stat,1For TCP, inspect duplicate acknowledgments, retransmissions, out-of-order packets and window changes. TCP detects loss and retransmits; UDP does not provide acknowledgment or retransmission itself. Therefore, an application using UDP can experience loss without a transport recovery signal. A capture at only one endpoint cannot prove where a packet disappeared; capture both ends when the question is directional.
Capture checklist
- Choose the correct interface and confirm it carries the test traffic.
- Apply a capture filter to limit volume, such as the test host and port.
- Synchronize clocks or record a common test start marker.
- Save the original capture before applying display filters.
- Compare sent sequence numbers, received sequence numbers and retransmissions.
6. Windows Pktmon: attribute local Windows drops
Pktmon is built into modern Windows and can capture packet traces, report packet-loss statistics and attribute local drops to reasons and code locations. Microsoft recommends combining Pktmon traces with Wireshark analysis.
Start a focused capture
pktmon filter remove
pktmon filter add -p 443
pktmon start --etw -p 0
Run the test, then stop and convert the result:
pktmon stop
pktmon etl2pcap PktMon.etl -o pktmon.pcapng
Open the PCAPNG file in Wireshark. Add filters for the affected address or port, and compare Pktmon’s drop events with application timestamps. Use this when ping and MTR show symptoms but you need to distinguish a local stack, driver, interface or filtering issue from a remote path issue.
A practical packet-loss investigation sequence
- Baseline: run 100 low-rate pings to the final destination and the local gateway.
- Localize: run traceroute or PathPing, then a 100-cycle MTR report.
- Load: run bidirectional iPerf3 UDP tests at several rates and durations between endpoints you control.
- Prove: capture the test with Wireshark/TShark when retransmissions, sequence gaps or protocol behavior matter.
- Attribute locally: add Pktmon on Windows if the host itself may be dropping packets.
- Correlate: compare tool timestamps, destination results, interface counters, application errors and link utilization.
How to avoid false packet-loss conclusions
- Intermediate hop loss: a router can rate-limit diagnostic replies while forwarding transit traffic. Always compare with the final destination.
- ICMP filtering: a failed ping may reflect policy, not a failed web request. Test the actual service or use iPerf3 between controlled endpoints.
- Asymmetry: forward and reverse routes can differ. Run tests in both directions.
- Bursty loss: short tests can miss queue drops. Use sustained MTR and iPerf3 runs.
- MTU problems: vary ping payload and iPerf3 datagram size. A small packet can succeed while a larger one fails.
- Wireless interference: compare wired and wireless baselines from the same location.
- Application retries: TCP retransmission can hide loss from users while increasing latency. Inspect captures and application timing.
Troubleshooting common errors
| Symptom | Likely cause | Fix |
|---|---|---|
| 100% ping loss but DNS works | ICMP blocked or deprioritized | Test the service port and use a controlled TCP/UDP test. |
| Loss at one MTR hop only | Probe rate limiting | Check later hops and the destination before escalating. |
| iPerf3 UDP reports zero receive rate | Firewall, wrong address or blocked UDP port | Open the selected port, verify server reachability and test the reverse direction. |
| High iPerf3 loss only at high bitrate | Congestion or queue overflow | Repeat at lower rates, check interface counters and inspect QoS. |
| Wireshark shows retransmissions but ping is clean | TCP-specific congestion, MTU or application-path issue | Capture the affected TCP flow and compare sequence and acknowledgment numbers. |
| Pktmon capture is empty | Wrong interface, filter or insufficient privileges | Remove filters, select the active interface and run the terminal as administrator. |
| Traceroute stops at asterisks | Hop filters probes | Continue to the destination and compare with MTR or a TCP traceroute mode. |
Performance, reliability and cost considerations
Ping, traceroute and MTR consume little bandwidth, but probe frequency still matters on constrained links. Prefer longer, lower-rate runs over aggressive bursts. iPerf3 creates real traffic and can affect users; schedule tests, cap the bitrate and retain JSON results. Packet captures consume disk and can contain sensitive addresses or payloads; use capture filters, protect files and delete them according to your retention policy. Repeat tests at different times and from multiple vantage points before declaring a persistent fault.
Or skip the browser setup
If your workflow also needs repeatable screenshots of monitoring pages, incident dashboards or test results, ScreenshotNeo provides a single website screenshot API request. Before capture it accepts cookie or consent banners and removes more than 60 known consent platforms, newsletter popups and chat widgets; each step can be turned off. Bot checks, blank pages, timeouts, failed loads and cache hits are not billed, and the response identifies the result with X-Page-Verdict and X-Billed headers.
See the ScreenshotNeo API documentation for all options. The basic call is:
cURL
curl -G "https://api.screenshotneo.com/v1/shot" -d access_key=YOUR_API_KEY --data-urlencode url=https://stripe.com -o shot.webpPython
import requests
r = requests.get("https://api.screenshotneo.com/v1/shot", params={"access_key": "YOUR_API_KEY", "url": "https://stripe.com"}, timeout=90)
open("shot.webp", "wb").write(r.content)
Node.js
const q = new URLSearchParams({ access_key: 'YOUR_API_KEY', url: 'https://stripe.com' });
const res = await fetch(`https://api.screenshotneo.com/v1/shot?${q}`);
ScreenshotNeo also supports full-page captures with lazy images loaded, CSS element capture, dark mode, device presets and custom viewports, retina scale, PDF output, custom CSS and JavaScript, clicks, selector waits, delays, network-idle waits, request blocking, custom headers/cookies/user agents, timezone and geolocation, transparent backgrounds, resizing, cache TTLs, signed links, asynchronous jobs with signed webhooks, bulk capture of up to 100 URLs per call, usage reporting and an OpenAPI specification. Its MCP server exposes take_screenshot, get_page_info and capture_pdf to Claude, Cursor and other MCP clients.
The Free plan includes 1,000 screenshots each month with no card. Paid plans start at $5 for 3,000 shots; every feature is available on every plan. Create a free ScreenshotNeo account.
FAQ
What percentage of packet loss is acceptable?
There is no universal threshold. Requirements depend on the application, path and traffic type. Establish a baseline for the same destination and compare loss, latency and jitter under the conditions that matter.
Does ping prove that a web application is healthy?
No. Ping tests ICMP reachability. A web service can fail while ICMP succeeds, or block ICMP while serving HTTP normally.
Should I use TCP or UDP with iPerf3?
Use UDP when you need explicit loss and jitter at a controlled bitrate. Use TCP to study throughput and congestion behavior; TCP recovers from loss and does not expose a direct loss percentage in the same way.
Can MTR identify the exact router dropping packets?
It can show where loss first appears and whether it continues to the destination. Intermediate routers may rate-limit probes, so MTR alone cannot prove that a particular router drops transit traffic.
Where should I capture with Wireshark?
Capture as close as possible to the sender or receiver relevant to the question. Capture both endpoints when you need to determine whether a packet was never sent, was lost in transit or arrived but was discarded locally.


