How to Use the Chrome DevTools MCP Server
Install Chrome DevTools MCP, connect it to an AI coding agent, automate Chrome, debug pages, and handle security, isolation, and troubleshooting.
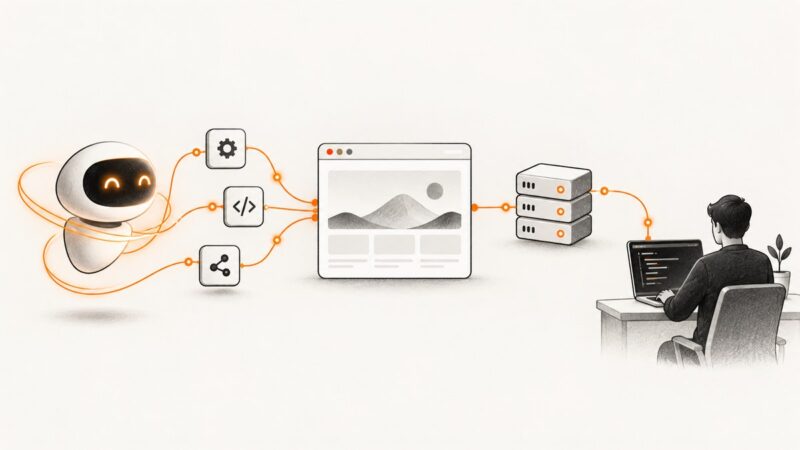
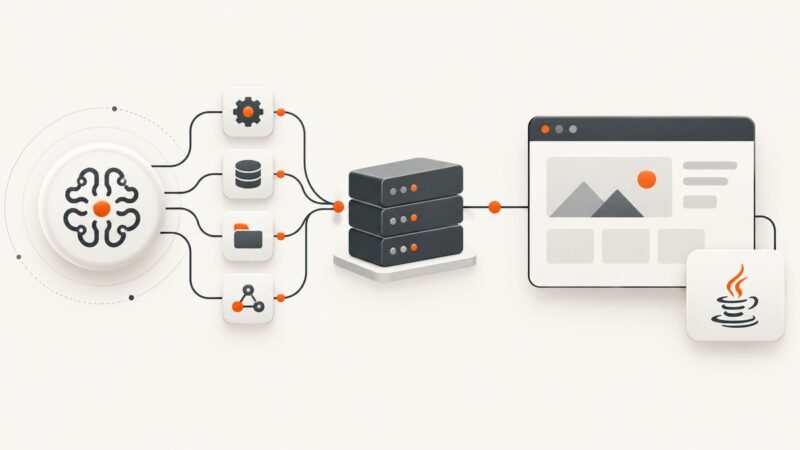
Chrome DevTools MCP Server lets an MCP client control and inspect a live Chrome browser. You install it with npm, configure your client to launch chrome-devtools-mcp, then ask an AI coding agent to navigate pages, inspect elements, run performance checks, examine network activity, and debug browser behavior.
The shortest setup is a machine with Node.js LTS, npm, and Chrome stable or newer, plus this MCP configuration:
{
  "mcpServers": {
    "chrome-devtools": {
      "command": "npx",
      "args": ["-y", "chrome-devtools-mcp@latest"]
    }
  }
}
The package is documented in the Chrome DevTools MCP project. Client configuration screens differ, so place the JSON in the MCP configuration file used by Claude, Cursor, or your other MCP client.
What Chrome DevTools MCP does
Chrome DevTools MCP is an npm-distributed software server. It exposes Chrome DevTools capabilities to an MCP client, allowing an agent to work with a real browser instead of relying only on HTTP requests or a DOM parser.
- Browser automation: open URLs, interact with pages, and inspect the current browser state.
- Debugging: investigate console output, page behavior, and runtime problems.
- Performance analysis: ask the agent to inspect loading and runtime performance.
- Network inspection: examine requests and responses when the selected tool scope supports it.
- Emulation: use documented device, viewport, and related emulation controls.
- Memory and diagnostics: enable the relevant categories when your workflow needs them.
Tool availability depends on the server configuration, Chrome version, and transport. Check the project’s current configuration guide before depending on experimental features.
Prerequisites
- Install Node.js LTS.
- Confirm that npm is available in the same environment.
- Install Chrome stable or newer.
- Choose an MCP client that can launch an MCP server, such as Claude, Cursor, or another compatible client.
node --version
npm --version
google-chrome --version
Use the Chrome executable name appropriate for your operating system. The server’s requirements and supported connection methods can change with new releases.
Install and configure the server
1. Add the standard configuration
Add this entry to your MCP client’s server configuration:
{
  "mcpServers": {
    "chrome-devtools": {
      "command": "npx",
      "args": ["-y", "chrome-devtools-mcp@latest"]
    }
  }
}
npx -y downloads and runs the package without a separate global install. The latest tag follows the current release. Pin an explicit version when repeatable builds or controlled upgrades matter:
{
  "mcpServers": {
    "chrome-devtools": {
      "command": "npx",
      "args": ["-y", "chrome-devtools-mcp@1.10.1"]
    }
  }
}
The researched registry manifest reported version 1.10.1 in September 2026. Verify the current package version before publishing or pinning it.
2. Restart or reload your MCP client
Most clients read server definitions when they start. Restart the client, reload its MCP integrations, or use its reconnect action. The client should then show the Chrome DevTools tools as available.
3. Run a first task
Start with a small request such as:
Open https://example.com and report the page title, visible headings, console errors, and a short performance summary.If the agent can open the page and return browser data, the basic connection works.
Choose how Chrome connects
There are four practical connection patterns. Pick one based on whether the browser should be isolated, reused, or reached from another environment.
| Approach | Use it when | Important details |
|---|---|---|
| Server launches Chrome | You want a simple, isolated workflow. | The standard configuration is usually enough. |
| Automatic connection | You want to reuse an eligible running Chrome profile. | The documented workflow requires Chrome 144+ and remote-debugging setup. You must approve the connection, and the server can access open windows in the selected default profile. |
| Browser URL | The server runs in a sandbox or separate environment. | Start Chrome with a debugging endpoint and configure --browser-url. Protect the endpoint. |
| WebSocket endpoint | Your environment supplies a WebSocket connection. | Configure --ws-endpoint and verify any required headers or endpoint authentication. |
Connecting with a browser URL
The exact command depends on your Chrome installation and the current server release. Conceptually, Chrome must start with a remote debugging port and the MCP server must receive that browser URL through its documented option.
google-chrome \
  --remote-debugging-port=9222 \
  --user-data-dir=/tmp/chrome-devtools-mcp-profile
Then configure the server with the option documented by the project:
{
  "mcpServers": {
    "chrome-devtools": {
      "command": "npx",
      "args": [
        "-y",
        "chrome-devtools-mcp@latest",
        "--browser-url=http://127.0.0.1:9222"
      ]
    }
  }
}
Use a non-default user-data directory when enabling remote debugging, as required by current Chrome behavior. Do not expose the debugging port beyond the smallest trusted boundary.
Connecting with a WebSocket endpoint
If your browser provider gives you a WebSocket endpoint, pass it using the server’s documented --ws-endpoint option. Confirm whether the endpoint needs authentication headers and whether your MCP client’s process can reach it.
Control the tool scope
The server supports a slim mode for basic browser work and switches for groups such as navigation, input, emulation, performance, network, debugging, and memory. A smaller scope makes the agent’s tool list easier to navigate; a broader scope is useful for diagnostics.
Start with the default or slim scope. Add categories only when a task requires them, and consult the current configuration guide for exact flag names and Chrome-version requirements. Some capabilities are experimental or require a particular transport.
Work safely with remote debugging
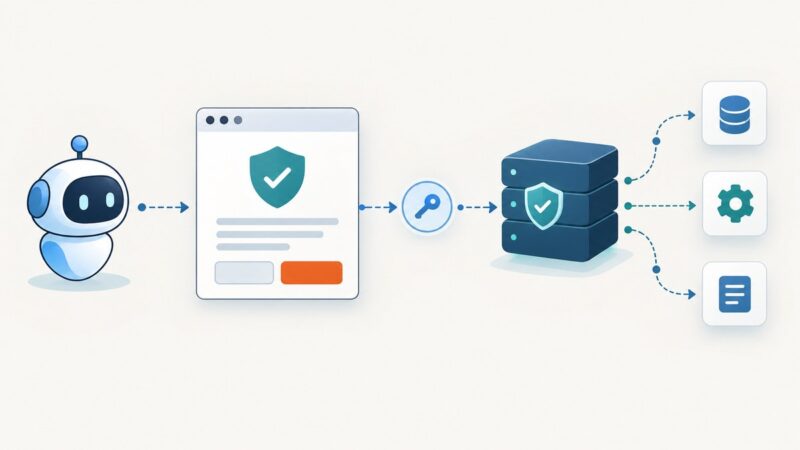
A remote debugging port grants browser control. The project’s warning is direct: “Any application on your machine can connect to this port and control the browser.”
- Bind the endpoint to a trusted local interface when possible.
- Use a temporary, separate Chrome profile.
- Close the debugging session when the task ends.
- Do not browse sensitive accounts while the port is open.
- Keep the debugging port out of shared networks and public interfaces.
- For concurrent work, use page-ID routing or the documented
--isolatedoption when each session needs a separate temporary profile.
Isolation changes browser state sharing. A shared profile preserves cookies and open pages; isolated profiles reduce cross-session leakage but require each session to authenticate independently.
Examples of useful agent requests
Inspect a page
Open https://example.com. List the document title, headings, links, and any console errors. Do not submit forms or change data.Investigate a slow page
Open the application URL, collect a performance overview, identify the largest loading delays, and separate network, rendering, and script issues.Check a responsive layout
Open the page at desktop and mobile emulation sizes. Report horizontal overflow, elements that become unreachable, and layout changes between viewports.Trace a failing request
Reload the page, inspect failed network requests, and report the request URL, status, initiator, and relevant console errors. Do not retry destructive requests.Performance and reliability considerations
- Startup: launching Chrome adds process and profile startup time. Reusing a controlled browser can reduce startup work.
- Profile state: shared profiles improve continuity but make results less reproducible. Temporary profiles improve repeatability.
- Tool scope: enabling only required categories keeps agent interactions simpler.
- Version drift:
@latestand automatic Chrome updates can change behavior. Pin the npm version and control Chrome updates when reproducibility is critical. - Parallel sessions: route pages deliberately and use isolation when sessions must not share cookies, local storage, or tabs.
- Network conditions: remote browsers and forwarded debugging endpoints add latency and can fail independently of the page under investigation.
Chrome DevTools MCP itself does not define a per-screenshot billing model. Any infrastructure, browser-hosting, or AI-client costs come from the environment you choose.
Troubleshooting
| Symptom | Likely cause | Fix |
|---|---|---|
npx is not found |
Node.js or npm is missing from the MCP process environment. | Install Node.js LTS and ensure the client inherits the correct PATH. |
| The server never appears | Malformed JSON or the client has not reloaded configuration. | Validate the JSON, restart the client, and inspect its MCP logs. |
| Chrome cannot be found | Chrome is not installed or is not on the expected path. | Install supported Chrome or use the connection method and executable settings documented for your platform. |
| Automatic connection fails | Chrome version, remote-debugging state, approval, or profile selection does not meet requirements. | Use the documented Chrome 144+ workflow, enable the required debugging setup, approve the connection, or launch an isolated browser instead. |
| Browser URL connection times out | The port is blocked, Chrome is not listening, or the server cannot reach the address. | Check the listening port locally, use a reachable address, and verify forwarding and firewall rules. |
| WebSocket connection fails | Wrong endpoint, missing headers, or unsupported transport configuration. | Copy the endpoint exactly, provide required headers, and confirm the current server documentation. |
| Pages contain another user’s cookies | A shared profile is being reused. | Use --isolated or a dedicated temporary user-data directory. |
| Some tools are missing | A slim scope or category switch disabled them. | Enable the required navigation, input, emulation, performance, network, debugging, or memory category. |
| Results change between runs | Dynamic content, shared state, browser updates, or an unpinned package. | Use a temporary profile, control inputs, pin the package, and record Chrome and server versions. |
Or skip the browser setup
If your goal is a clean, repeatable website image or PDF rather than interactive DevTools control, ScreenshotNeo provides a single HTTP request. Its API accepts a URL and returns PNG, JPEG, WebP, or PDF; the documentation lists the available options.
curl -G "https://api.screenshotneo.com/v1/shot" -d access_key=YOUR_API_KEY --data-urlencode url=https://stripe.com -o shot.webpimport requests
r = requests.get("https://api.screenshotneo.com/v1/shot", params={"access_key": "YOUR_API_KEY", "url": "https://stripe.com"}, timeout=90)
open("shot.webp", "wb").write(r.content)const fs = require('node:fs');
const q = new URLSearchParams({ access_key: 'YOUR_API_KEY', url: 'https://stripe.com' });
const res = await fetch(`https://api.screenshotneo.com/v1/shot?${q}`);
if (!res.ok) throw new Error(`HTTP ${res.status}`);
fs.writeFileSync('shot.webp', Buffer.from(await res.arrayBuffer()));ScreenshotNeo accepts cookie and consent banners before capture and removes more than 60 known consent platforms, newsletter popups, and chat widgets. Each step can be disabled. Bot checks, blank pages, timeouts, failed loads, and cache hits are not billed, and response headers report the page verdict and whether the shot was billed. It also offers an MCP server with take_screenshot, get_page_info, and capture_pdf for Claude, Cursor, and other MCP clients. The free plan includes 1,000 screenshots per month with no card; paid plans start at $5 for 3,000 shots. Create a free ScreenshotNeo account.
FAQ
Is Chrome DevTools MCP a Chrome extension?
No. It is an npm package that runs as an MCP server and connects an MCP client to Chrome DevTools capabilities.
Can it use my existing Chrome session?
Yes, through the documented automatic connection or browser URL/WebSocket workflows, provided Chrome and the debugging setup meet the current requirements.
Should I use latest in production?
Use latest for convenience. Pin a specific version when reproducibility and controlled upgrades are more important.
Does it replace browser testing?
It can help an agent inspect and exercise a browser, but your test framework, assertions, credentials, and deployment environment still determine test coverage.
How do I prevent sessions from sharing state?
Use the documented isolated mode or separate temporary Chrome profiles, then route each client to its own browser session.