How to Visually Test D3, Highcharts, and SVG Charts
Build stable chart screenshot tests for D3, Highcharts, and SVG, then pair pixel diffs with accessibility and interaction checks.
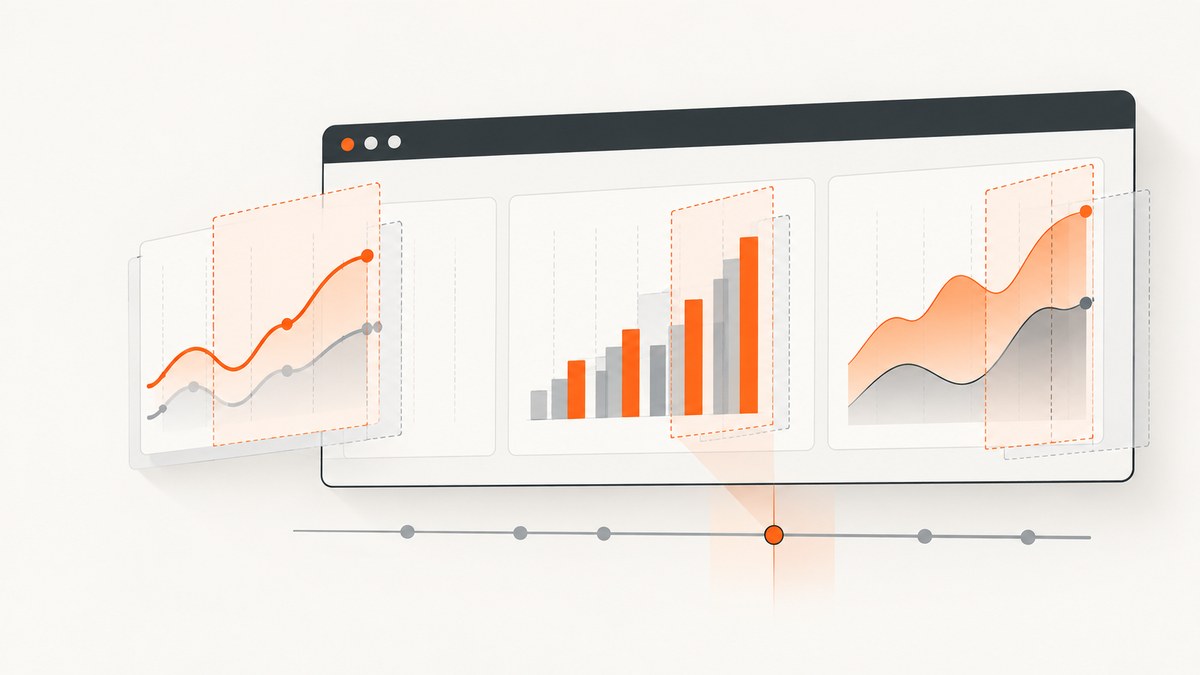
Direct answer: visually test D3, Highcharts, and raw SVG charts with a deterministic browser harness. Render each chart at fixed viewport sizes, wait for data and fonts, disable or finish animations, exercise important interaction states, and compare screenshots with reviewed baselines. Pair every image diff with DOM, ARIA, keyboard, and data assertions so a chart that looks unchanged cannot silently lose accessibility or behavior.
This approach works for pull requests, release checks, and cross-browser reviews. D3 gives you low-level control over SVG and Canvas, Highcharts supplies chart behavior and an accessibility module, and raw SVG gives you direct markup control. Your test strategy should reflect those differences.
What to test in every chart
Start by writing a state matrix. A single “chart rendered” screenshot catches only a fraction of regressions.
| Area | States and checks |
|---|---|
| Rendering | Initial, loaded, empty, loading, and error states; axes, scales, paths, bars, clipping, labels, and tick density. |
| Responsive layout | Desktop, tablet, narrow mobile, and each application breakpoint. Check legend wrapping, label rotation, and plot margins. |
| Interaction | Hover tooltips, focused points, keyboard navigation, legend or series toggles, zoom, brush, pan, and export previews. |
| Visual design | Colors, contrast, patterns, dash styles, font fallback, grid lines, annotations, and tooltip placement. |
| Semantics | Chart title, axis names, visible description, roles, accessible names, focus visibility, and a data table or equivalent alternative. |
Keep the state list in source control. When a new control such as a brush or drill-down is added, add its visual and semantic checks in the same change.
Make rendering deterministic before taking screenshots
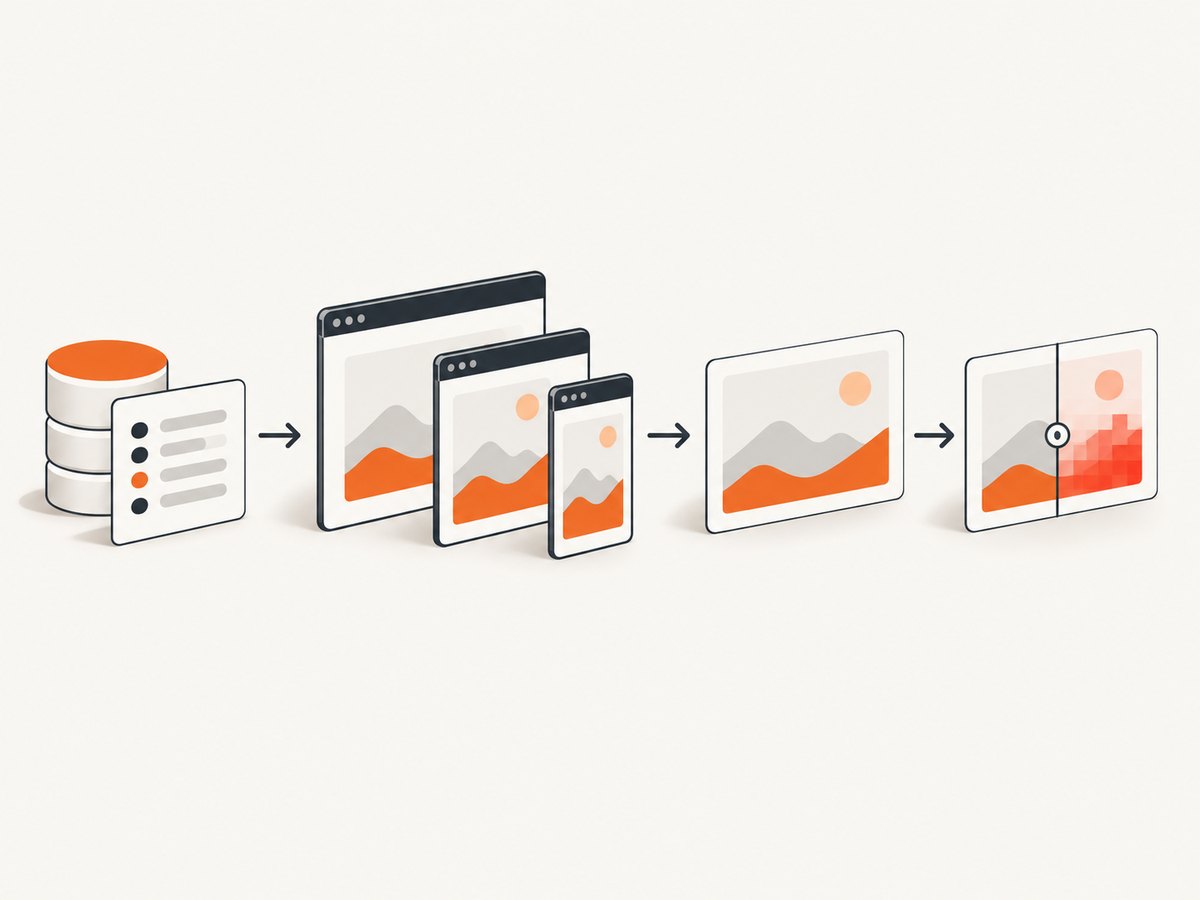
Screenshot comparisons are meaningful only when the input and rendering environment are stable. Pin the browser version and run baselines in the same operating-system or container image. Browser rendering can vary with OS, browser version, settings, hardware, power source, and headless mode, as documented by Playwright.
Control the inputs
- Use fixture data checked into the repository. Avoid “now”, random IDs, live exchange rates, and API responses that change during a run.
- Mock network requests and return the same JSON, status codes, and response delays for every test.
- Set a fixed locale, timezone, and number format. Dates such as
2026-01-05should render identically on every worker. - Bundle or pin fonts. Wait for
document.fonts.readybefore capture; a fallback font changes line breaks and label positions. - Disable transitions and animations for the test run. For CSS, inject a stylesheet that sets animation and transition duration to zero. For D3, skip the transition call in test mode. For Highcharts, configure chart animation off.
- Wait for the chart’s own ready signal, not an arbitrary short delay. Also wait for images, web fonts, and any lazy-loaded data used by annotations.
Playwright project setup
Install Playwright and create a project with a pinned browser in CI. The following test captures a chart at a named viewport and compares it with a committed baseline.
import { test, expect } from '@playwright/test';

test('sales chart baseline', async ({ page }) => {
  await page.setViewportSize({ width: 1280, height: 800 });
  await page.goto('http://localhost:3000/charts/sales?fixture=stable', {
    waitUntil: 'networkidle'
  });
  await page.evaluate(async () => {
    await document.fonts.ready;
    document.querySelectorAll('svg [data-animate]').forEach((el) => {
      el.setAttribute('data-animate-disabled', 'true');
    });
  });
  await page.locator('[data-chart-ready="sales"]').waitFor();
  await expect(page).toHaveScreenshot('sales-desktop.png', {
    animations: 'disabled',
    caret: 'hide',
    maxDiffPixels: 40
  });
});
Run once to create a baseline, review it, and commit it. Later runs compare against that file. Set maxDiffPixels only after measuring normal rendering noise; a generous threshold can hide a real defect. Playwright also supports stylePath for hiding volatile overlays during capture.
D3 visual tests
D3 is a free, open-source JavaScript library for visualizing data. It uses web standards such as SVG and Canvas, and selections directly mutate the DOM. Because D3 is a low-level toolbox rather than a chart abstraction, assert your project’s own structure and behavior.
Expose stable hooks
Add durable attributes to the chart you own:
<svg data-chart='revenue' role='img' aria-labelledby='revenue-title revenue-desc'>
  <title id='revenue-title'>Monthly revenue</title>
  <desc id='revenue-desc'>Revenue rises from January through June.</desc>
  <g data-series='actual'>...</g>
</svg>
Test the count and meaning of marks, not implementation details such as generated class names. Useful assertions include the number of bars, the domain of each scale, path bounds, axis labels, and whether hidden data is excluded from the accessibility tree.
test('D3 chart has expected geometry and labels', async ({ page }) => {
  await page.goto('http://localhost:3000/charts/d3?fixture=q1');
  const chart = page.locator('[data-chart="revenue"]');
  await expect(chart).toHaveAttribute('role', 'img');
  await expect(chart.locator('[data-series="actual"] path')).toHaveCount(1);
  await expect(chart.locator('.x-axis text')).toHaveCount(6);
  await expect(chart.locator('title')).toHaveText('Monthly revenue');
  await expect(chart).toHaveScreenshot('d3-revenue.png');
});
For Canvas charts, screenshot the rendered pixels and separately assert the data model used to draw them. Canvas has no chart semantics unless you provide an accessible DOM alternative.
Highcharts visual tests
Highcharts includes an Accessibility module with text descriptions, keyboard navigation, ARIA roles and attributes, screen-reader support, and data-table and export options. Highcharts recommends always including the module. Load it in the application and test the resulting accessibility tree, not just the SVG pixels.
import Highcharts from 'highcharts';
import Accessibility from 'highcharts/modules/accessibility';
Accessibility(Highcharts);

Highcharts.chart('container', {
  accessibility: {
    enabled: true,
    description: 'Monthly revenue increases from January to June.'
  },
  chart: { animation: false },
  plotOptions: { series: { animation: false } },
  series: [{ name: 'Revenue', data: [12, 18, 21, 24, 31, 35] }]
});
Capture the initial chart, then drive each state before taking a screenshot. For example, hover a point and assert that the tooltip contains the expected value; focus a point with the keyboard and assert a visible focus indicator; click a legend item and verify that the series disappears from both the image and the accessible description.
test('Highcharts tooltip and legend state', async ({ page }) => {
  await page.goto('http://localhost:3000/charts/highcharts');
  await page.locator('.highcharts-point').nth(2).hover();
  await expect(page.locator('.highcharts-tooltip')).toContainText('21');
  await expect(page).toHaveScreenshot('highcharts-tooltip.png');

  await page.getByText('Revenue').click();
  await expect(page.locator('.highcharts-series')).toHaveCount(0);
  await expect(page).toHaveScreenshot('highcharts-hidden-series.png');
});
Highcharts notes that final WCAG compliance remains your responsibility because configuration and custom code change the resulting content. Check your chart with the assistive technologies used by your audience.
Raw SVG visual tests
Raw SVG is straightforward to snapshot because geometry and semantics are explicit. Give every important group a stable identifier, set a viewBox, and avoid layout that depends on an unconstrained parent.
test('raw SVG preserves viewBox and accessible name', async ({ page }) => {
  await page.goto('http://localhost:3000/charts/raw-svg');
  const svg = page.locator('svg[data-chart="temperature"]');
  await expect(svg).toHaveAttribute('viewBox', '0 0 800 400');
  await expect(svg).toHaveAttribute('aria-label', /temperature/i);
  await expect(svg.locator('[data-mark]')).toHaveCount(24);
  await expect(svg).toHaveScreenshot('temperature.svg.png');
});
Test resize behavior by changing the viewport and waiting for the chart’s resize observer to settle. Assert that labels remain inside the viewBox and that no important mark is clipped.
Responsive and interaction coverage
Use a small, intentional viewport matrix rather than dozens of nearly identical sizes. Include every CSS breakpoint and one size just above and below each breakpoint. Highcharts’ cross-platform guidance describes capturing charts at different viewport sizes and comparing them pixel by pixel.
- Render at 1440px desktop, 1024px tablet, 768px tablet portrait, and 390px mobile, plus application-specific breakpoints.
- Capture loaded, empty, error, and long-label fixtures. Long labels expose clipping and unexpected wrapping.
- Exercise hover, focus, keyboard navigation, legend toggles, zoom or brush ranges, and export previews.
- For touch layouts, test pointer events with a touch-enabled context and verify that tooltips do not require hover.
Keep separate baselines for browser engines when you support more than one. Do not blur screenshots or hide differences globally; instead, mask only known volatile regions such as timestamps or cursors.
Accessibility checks that screenshots miss
Highcharts advises that color must not be the sole carrier of meaning. Add labels, series labels, dash styles, or pattern fills, and inspect the result in grayscale and with color-vision simulation. A screenshot can look perfect while the chart loses its title, focus order, or screen-reader description.
- Assert a meaningful title and axis labels.
- Assert a concise visible description where practical.
- Tab through the chart and verify keyboard reachability and visible focus.
- Inspect roles, accessible names, descriptions, and hidden states with an accessibility-tree or axe check.
- Provide a data table or equivalent text alternative for complex charts.
For custom D3 and SVG, inspect the final DOM and ARIA tree directly because D3 supplies primitives rather than a chart-level accessibility contract.
Reviewing diffs and preventing flaky tests
Classify each diff before changing a baseline. Scale or axis changes usually indicate data or configuration drift. Label movement often points to fonts, locale, or responsive CSS. Missing marks can mean a failed request, a clipping path change, or an animation captured too early. Tooltip movement may be expected when the pointer target changed, so pair the image with a text assertion.
When a test flakes, save the failure screenshot and browser trace. Confirm the fixture response, font readiness, chart-ready signal, and viewport. If only one worker fails, compare its browser and OS image with the baseline environment. Avoid random retries: retries can conceal a race between rendering and capture.
Troubleshooting common failures
| Symptom | Likely cause | Fix |
|---|---|---|
| Blank or partial chart | Capture occurs before data, fonts, or lazy assets finish. | Wait for a chart-ready marker, mocked response completion, and document.fonts.ready. |
| Diffs on every run | Animations, random data, timestamps, or an unstable font. | Disable motion, freeze inputs, pin fonts, and use deterministic fixtures. |
| Only CI fails | Different browser, OS, device scale factor, or headless mode. | Pin the CI image and browser; regenerate baselines there. |
| Mobile labels overlap | Breakpoint rule or tick density is not handled. | Add a narrow fixture, assert label bounds, and configure responsive ticks or rotation. |
| Tooltip is missing | Hover target is covered, pointer moved, or tooltip renders in a portal. | Hover the exact mark, wait for the tooltip locator, and include its portal container in the assertion. |
| Accessible name disappears | Chart library module was not loaded or custom SVG replaced the title. | Load Highcharts Accessibility, preserve title/desc, and assert the accessibility tree. |
Performance, reliability, and cost
Keep visual suites fast by mocking data, reusing a browser context, and limiting screenshots to meaningful states. Run a focused chart project on every pull request and a broader browser or viewport matrix on scheduled builds. Store baselines with the code so a visual change is reviewed alongside its implementation.
Screenshot diffs are not a substitute for functional tests. A fast pixel comparison can still miss incorrect values rendered with the same geometry, while a DOM assertion can miss a one-pixel clipping defect. Use both. Treat baseline updates as code review decisions and record why each intentional visual change is expected.
Hosted screenshot services can reduce browser maintenance for pages that do not need in-process interaction. Compare the service’s rendering controls, failure behavior, cache policy, and pricing with the cost of maintaining browsers and CI workers. For interactive chart states, keep Playwright or an equivalent harness because the test must drive the chart before capture.
Or skip the browser setup
ScreenshotNeo provides a single GET request that returns a PNG, JPEG, WebP, or PDF. You can point it at a chart route after your application has rendered the desired default state. The API supports full-page capture, CSS-selector element capture, viewport and device presets, retina scale, dark mode, custom CSS and JavaScript, waits for a selector, delay or network idle, custom headers and cookies, blocking of ads or resource types, caching with a chosen TTL, signed links, async jobs, bulk capture, and PDF options. See the ScreenshotNeo API documentation for parameter names and configuration.
cURL:
curl -G 'https://api.screenshotneo.com/v1/shot' \
  -d access_key=YOUR_API_KEY \
  --data-urlencode url=https://your-site.example/charts/sales \
  -o chart.webp
Python:
import requests

r = requests.get(
    'https://api.screenshotneo.com/v1/shot',
    params={
        'access_key': 'YOUR_API_KEY',
        'url': 'https://your-site.example/charts/sales'
    },
    timeout=90
)
r.raise_for_status()
open('chart.webp', 'wb').write(r.content)
Node.js:
const q = new URLSearchParams({
  access_key: 'YOUR_API_KEY',
  url: 'https://your-site.example/charts/sales'
});
const res = await fetch(`https://api.screenshotneo.com/v1/shot?${q}`);
if (!res.ok) throw new Error(`Screenshot failed: ${res.status}`);
const image = Buffer.from(await res.arrayBuffer());
await import('node:fs/promises').then(fs => fs.writeFile('chart.webp', image));
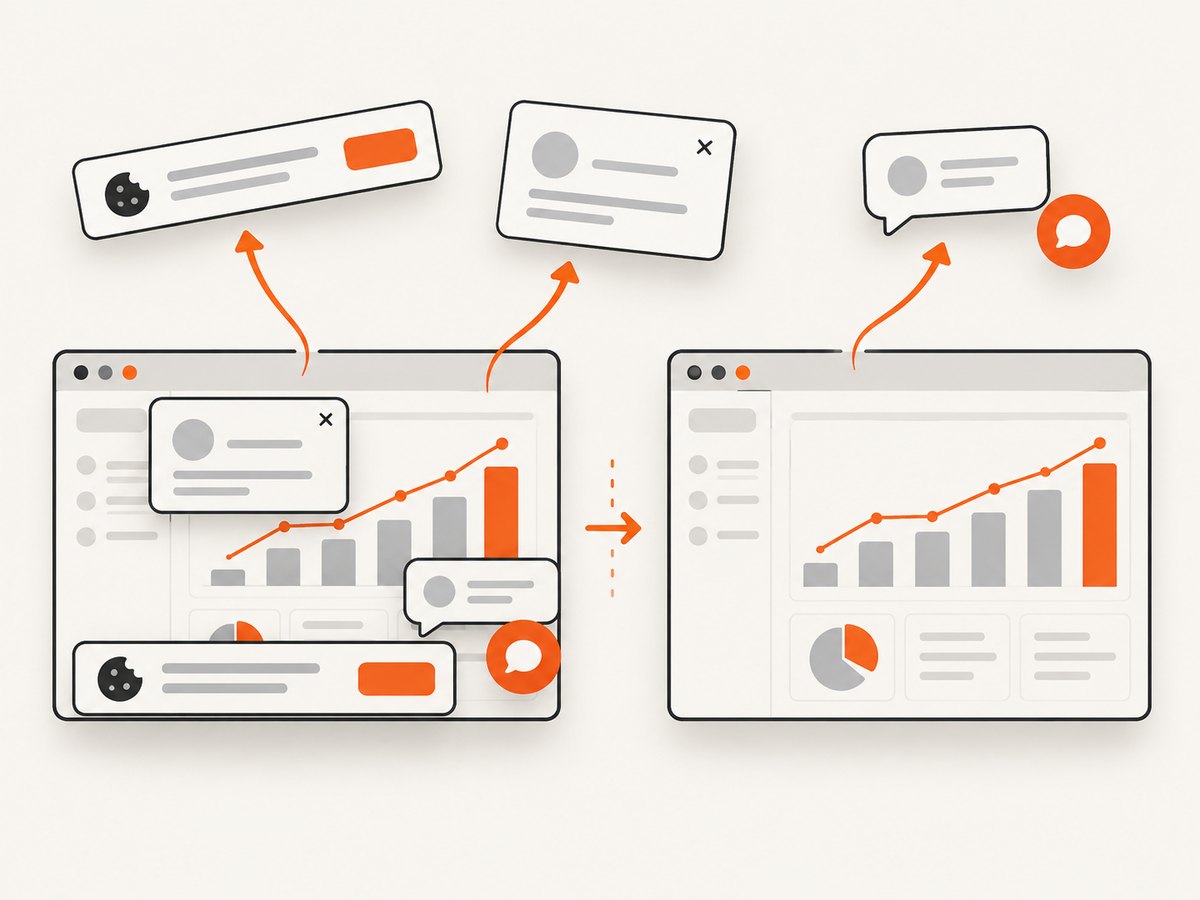
Before capture, ScreenshotNeo accepts cookie and consent banners and removes more than 60 known consent platforms, newsletter popups, and chat widgets; each step can be turned off. Bot checks or CAPTCHAs, blank pages, timeouts, failed loads, and cache hits are not billed. Response headers identify the page verdict and whether the shot was billed. Its MCP server provides take_screenshot, get_page_info, and capture_pdf tools for Claude, Cursor, and other MCP clients.
Plans include 1,000 shots per month free with no card, then $5 for 3,000, $15 for 15,000, $39 for 60,000, $99 for 250,000, and $249 for 1,000,000; yearly billing gives two months free. Create a free ScreenshotNeo account and start with the no-card monthly allowance.
FAQ
Should I compare screenshots on every commit?
Run a focused set on pull requests and the full viewport and browser matrix on scheduled or release builds. Always review baseline changes.
Can a screenshot prove a chart is accessible?
No. Pair screenshots with DOM, ARIA, keyboard, focus, and text-alternative assertions.
How should I test animated charts?
Test the final settled state for visual regression, and add a separate behavior test for animation start, progress, and completion if animation is part of the product.
Is D3 or Highcharts easier to test?
Highcharts provides more built-in behavior and accessibility support. D3 and raw SVG provide more control, so your project must define and assert more of the chart contract.