How to Add Website Monitoring to Your MCP Stack
Connect website checks to an MCP client, limit agent permissions, and track monitoring results separately from MCP tool health.
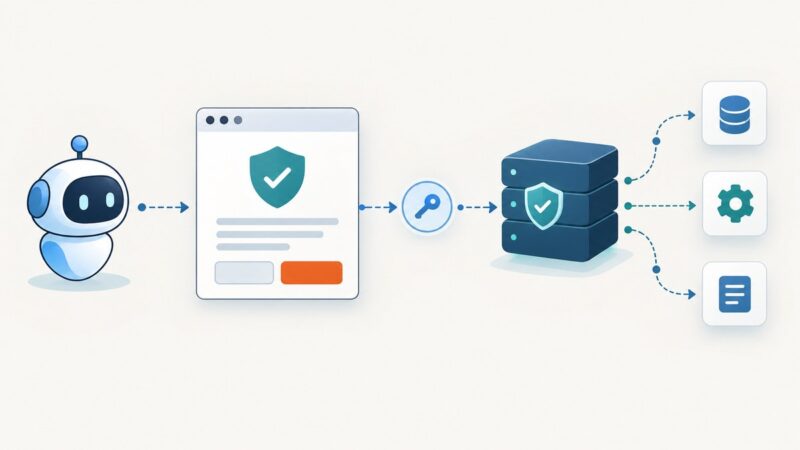
To add website monitoring to an MCP stack, connect an MCP client to a monitoring provider’s MCP server, authorize it with a narrowly scoped identity, discover its tools, and verify that a low-risk query returns data for the intended account. Then instrument the MCP integration separately: website checks tell you whether the target site is healthy; MCP observability tells you whether tool calls, transport, and agent operations are healthy.
For example, Google Cloud documents a hosted Cloud Monitoring MCP endpoint at https://monitoring.googleapis.com/mcp using Streamable HTTP and OAuth/IAM authorization. UptimeRobot offers uptime, incident, and response-time information through its MCP integration. A provider’s website checks do not automatically reveal MCP protocol errors or tool latency.
1. Decide what you need to monitor
There are two related but distinct layers. Define the question each layer should answer before wiring tools into an agent.
| Layer | Questions it answers | Examples of useful signals |
|---|---|---|
| Target website | Can visitors reach the site? Has its response or content changed? | Uptime, response time, SSL, DNS, visual changes, content changes, incidents |
| MCP integration | Can the agent reach the server and use its tools reliably? | Protocol health, tool invocation count and duration, transport latency, errors, end-to-end operation latency |
Google describes MCP as a standard way for AI applications and agents to connect to external data sources. An MCP connection gives an agent access to tools; it does not by itself create an alerting policy or guarantee that the provider checks the particular user journey you care about.
2. Choose a provider and connection pattern
Pick the integration based on coverage, transport, client support, authorization, and the history or query depth you need. Confirm the client supports the provider’s connection method before provisioning credentials.
| Option | Documented fit | Check before adopting |
|---|---|---|
| Google Cloud Monitoring remote MCP | Hosted endpoint https://monitoring.googleapis.com/mcp, Streamable HTTP, OAuth 2.0 and IAM |
Client support for Streamable HTTP and the documented OAuth/IAM flow; required roles and project scope |
| UptimeRobot MCP | Uptime, incidents, status summaries, and response-time series with windows from 1 hour through 90 days | Whether the desired queries fit the account’s API quota and whether to use OAuth or a read-only API key |
| Visual Sentinel MCP server | Project documents 16 tools covering monitor and incident tasks plus public DNS, SSL, speed, and website checks | Local process and client compatibility; permissions of the API key; whether public-tool results could be exposed in conversation logs |
A hosted remote server runs on the provider’s infrastructure and avoids managing a local server process. A local server can suit local development, testing, or offline use. Google Cloud documents both patterns and notes those local-use cases; client support differs, so check the client’s configuration options.
For MCP observability, Grafana’s documentation separates protocol health, tool analytics, transport performance, and end-to-end operation latency. Use those categories to decide what to collect; don’t assume the monitoring provider’s MCP tools report on the MCP server itself.
3. Connect and verify the MCP server
- Choose a provider and confirm its endpoint or local package, transport, and authentication flow are supported by your AI client.
- Create a dedicated agent identity or credential. Grant only the roles and API actions needed for the queries or changes the agent will perform.
- Configure the client using the provider’s documented setup. Keep credentials in the client’s supported secret store or environment configuration; do not paste long-lived keys into prompts or shared conversation logs.
- Use MCP tool discovery (
tools/list) if the client exposes it. Review tool names and descriptions, especially tools that can create, edit, pause, or delete monitors. - Ask a low-risk question about a known monitor, such as whether it is up or whether there were recent incidents. Confirm the response refers to the expected account, project, and monitor.
- Record which credential is used, how it can be rotated or revoked, and whether calls consume the provider’s API quota.
For Google Cloud, the documented permissions include roles/mcp.toolUser for making MCP tool calls and roles/monitoring.admin for using Monitoring MCP tools. Follow the current Google Cloud setup documentation to determine the least-privilege roles appropriate to your tasks and project.
4. Add checks for the website
Choose checks based on the failure you need to detect. An uptime check is useful for reachability, but a business-critical flow may also need response-time, SSL/DNS, visual, or content checks. Establish what counts as a failure and how often an agent should query status; an MCP query is not necessarily the same thing as a scheduled monitor check.
- Availability: query status and recent incidents for a named monitor.
- Performance: inspect response-time history at a time range that matches the incident. UptimeRobot documents response-time series windows from 1 hour to 90 days.
- SSL and DNS: add these when certificate expiry or name resolution is part of the risk you are tracking.
- Visual or content change: use a provider that documents those checks if page appearance or specific content matters.
- Scope: identify the account, project, monitor, and time range explicitly in prompts so answers are less likely to mix unrelated resources.
Start with read-only questions. If the workflow later needs the agent to create or change monitors, review the exact state-changing tools, permissions, and confirmation behavior first.
5. Observe the MCP integration itself
Instrument the agent-to-server path in addition to the target site. Useful signals include:
- Protocol health: connection and protocol errors, failed initialization, and tool discovery failures.
- Tool analytics: invocation volume by tool, success and failure counts, and duration.
- Transport performance: request latency and transport errors between client and server.
- End-to-end operation latency: elapsed time for an agent task that includes one or more MCP calls.
Keep enough context to investigate an error—such as tool name, timestamp, duration, and a request or trace identifier where available—while limiting sensitive payloads in logs. Grafana documents these observability categories as distinct aspects of MCP monitoring. A website being up does not prove the agent’s MCP transport is working; a successful MCP call does not prove the site is healthy.
6. Secure credentials and control agent actions
- Use a separate identity for the agent when the provider supports it, and make its access reviewable and monitored.
- Grant query-only access if the agent only needs status and history. UptimeRobot documents a read-only API key for query-only use; its Main API Key carries the account’s permissions.
- Check whether any exposed tools mutate monitoring state. A Visual Sentinel read-only key cannot create monitors; state-changing tools inherit the API-key role permissions.
- Understand credential revocation. UptimeRobot’s guide says an OAuth-authorized AI client cannot currently be individually reviewed or revoked in its dashboard; removal requires contacting support.
- Assume tool outputs may be visible to people who can read the assistant conversation logs. Visual Sentinel explicitly warns about public-tool results in logs.
- Review quota use and provider terms. UptimeRobot says MCP calls share the API request quota with direct API requests, with limits depending on plan and applied per rolling 60-second window.
The NSA’s MCP security guidance identifies risks including dynamic tool invocation, implicit trust relationships, and context sharing. Keep permissions narrow, inspect state-changing tools, and account for what can enter conversation context.
7. Troubleshoot common problems
| Symptom | Likely cause | What to check or fix |
|---|---|---|
| Client cannot connect to the remote server | Unsupported transport, incorrect endpoint, network restriction, or incomplete client configuration | Verify the endpoint exactly, confirm Streamable HTTP support for Google Cloud’s remote server, and follow the client and provider setup steps. |
| Authentication fails or tools return permission errors | Expired or incorrect OAuth credentials, wrong project/account, or missing IAM/API permissions | Reauthorize using the provider’s documented flow; verify identity, project scope, and required roles. Use a dedicated agent identity. |
| No tools appear | Initialization/discovery failed or the server exposes a different tool set than expected | Retry discovery with tools/list if available, inspect client/server logs, and compare against provider documentation. |
| The agent reports the wrong monitor or project | Ambiguous prompt, broad account access, or context from another conversation | Name the account/project and monitor explicitly, narrow permissions, and verify returned identifiers before acting. |
| Queries are rate limited | MCP requests count against the provider API quota or calls are concentrated in a short window | Check plan limits and recent call volume. For UptimeRobot, MCP and direct API requests share quota on a rolling 60-second window; exact limits depend on plan. |
| Website is healthy but MCP calls fail | Target-site checks and MCP integration health are different layers | Inspect protocol, transport, tool errors, and end-to-end operation latency separately from website status. |
| MCP call works but users still report an outage | The queried monitor may not cover the failing route, region, browser behavior, or user flow | Confirm the monitor’s target and check coverage; add appropriate checks for the affected path or behavior. |
| Unexpected monitor changes occur | The agent has access to state-mutating tools or a credential with broad permissions | Remove write permissions, review tool invocations and identity scope, rotate credentials if needed, and define approval steps for changes. |
8. Performance, reliability, and cost considerations
- Latency: account for client-to-server transport time, provider processing, and the monitoring data’s own freshness. Record tool duration and end-to-end task duration so a slow result can be localized.
- Reliability: an MCP integration adds another dependency to an agent workflow. Decide what the agent should say or do when the MCP server is unavailable, a query times out, or the provider returns partial history. Do not describe missing data as proof that a site is down.
- Quota: check whether MCP calls share limits with API calls, whether there are per-minute windows, and how retries count. UptimeRobot explicitly says its MCP calls share the direct API request quota.
- Query volume: avoid repeated polling from an agent when scheduled provider monitors already check the site. Use targeted history queries to investigate incidents.
- Data handling: avoid sending secrets or unnecessary personal data through tool arguments and conversation logs. Retain only operational details needed to diagnose failures.
9. Add visual evidence with ScreenshotNeo
Website health data can tell an agent that a page responded; a screenshot can show what rendered. ScreenshotNeo is a website screenshot API and MCP server from ScreenshotNeo. It supports an HTTP screenshot request returning PNG, JPEG, WebP, or PDF, and an MCP server with take_screenshot, get_page_info, and capture_pdf. This can complement uptime and MCP observability when a developer needs visual evidence of a page.
Or skip the browser setup:
curl -G "https://api.screenshotneo.com/v1/shot" -d access_key=YOUR_API_KEY --data-urlencode url=https://stripe.com -o shot.webpimport requests
r = requests.get("https://api.screenshotneo.com/v1/shot", params={"access_key": "YOUR_API_KEY", "url": "https://stripe.com"}, timeout=90)
open("shot.webp", "wb").write(r.content)const q = new URLSearchParams({ access_key: 'YOUR_API_KEY', url: 'https://stripe.com' });
const res = await fetch(`https://api.screenshotneo.com/v1/shot?${q}`);See the ScreenshotNeo API documentation for request options. Cookie banners, newsletter popups, and chat widgets are removed before the shot; each cleanup step can be turned off. Bot checks, blank pages, failed loads, timeouts, and cache hits are not billed, and response headers identify the page verdict and billing status. The MCP server lets AI agents take screenshots. The free plan includes 1,000 screenshots a month with no card; paid plans start at $5 for 3,000 screenshots. Create a free ScreenshotNeo account.
FAQ
Can my AI assistant check whether my website is down?
Yes, if its MCP client is connected to a provider tool that can query the relevant monitor and the agent has permission to access it. Verify the monitor identity and scope in the response.
Does a website monitoring MCP server monitor MCP tool calls?
Only if it explicitly documents protocol, tool, transport, or operation observability. Website availability and MCP integration health are separate concerns.
Should I use a hosted or local MCP server?
Use a supported hosted endpoint when you want the provider-managed remote service; use a local process when its development or offline advantages fit your environment. Check client transport compatibility and credential handling either way.
Can I let an agent change monitors?
Some integrations expose state-changing operations, subject to the API key’s permissions. Give write access only when the workflow requires it and inspect the tools and revocation path first.