What Is CDP? Chrome DevTools Protocol Explained
Learn what CDP is, how domains, targets, commands, and events fit together, and when to use raw CDP, Playwright, or a screenshot API.
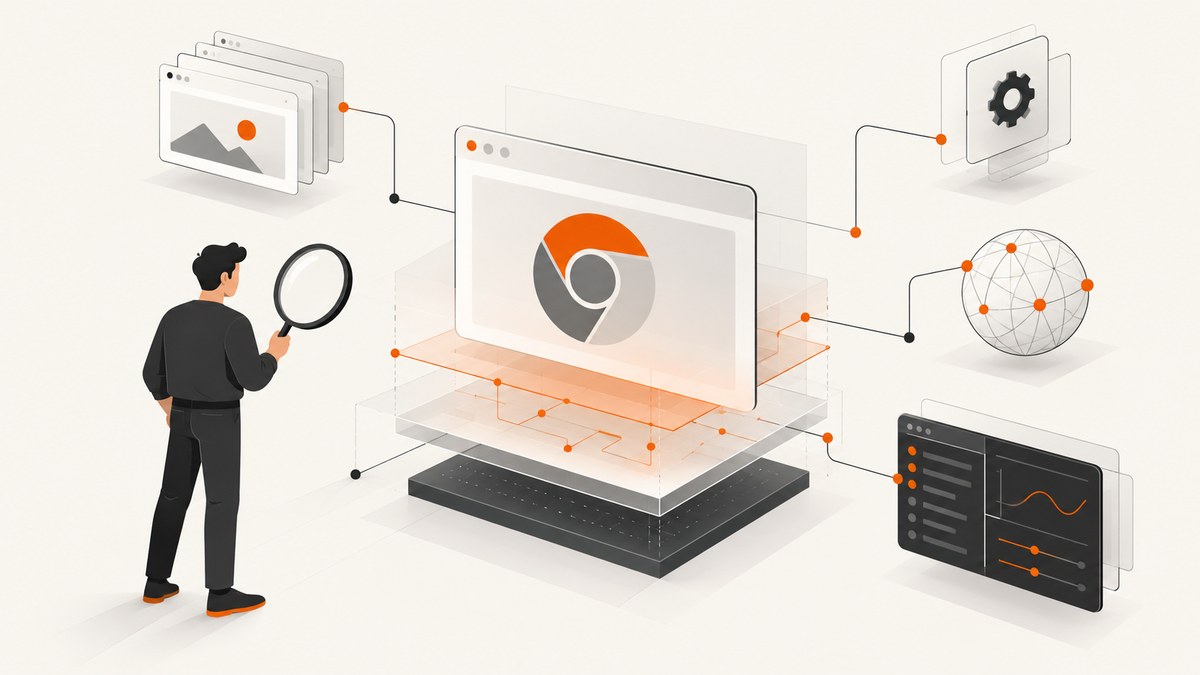
Chrome DevTools Protocol (CDP) is the structured protocol that lets developer tools and other clients instrument, inspect, debug, and profile Chromium, Chrome, and other Blink-based browsers. A CDP client sends JSON commands to a browser target and receives JSON results and events. The interface is divided into domains such as DOM, Debugger, and Network.
CDP is the browser communication layer, not an automation product by itself. You can use it directly for low-level control, or use a higher-level tool such as Playwright that connects through a CDP endpoint and gives you browser, page, locator, and assertion workflows. The official overview describes CDP as the interface for tools to “instrument, inspect, debug and profile Chromium, Chrome and other Blink-based browsers.” Read the protocol overview.
CDP in one mental model
Think of a browser as a server exposing a set of typed capabilities:
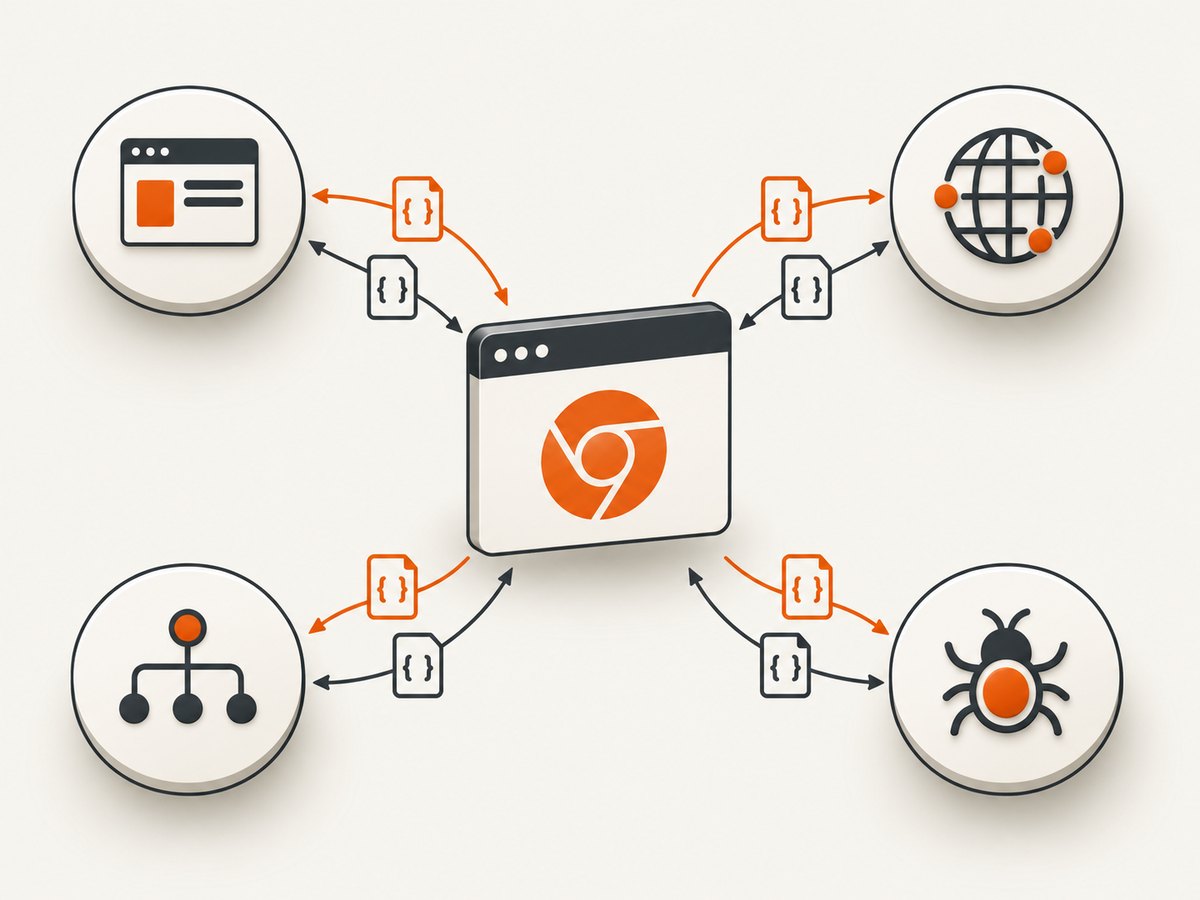
- Target: the thing being inspected, such as a tab, iframe, worker, or another debuggable browser context.
- Session: the connection context created when a client attaches to a target.
- Domain: a capability group, such as
Page,Runtime,DOM,Network, orDebugger. - Command: a request such as
Page.navigateorRuntime.evaluate. - Event: an asynchronous notification such as
Page.loadEventFiredorNetwork.requestWillBeSent.
Messages are JSON objects. A command includes an incrementing id, a method name, and optional parameters. The browser replies with the same id, or emits events without a matching request id.
{
  "id": 1,
  "method": "Page.navigate",
  "params": { "url": "https://example.com" }
}

{
  "id": 1,
  "result": { "frameId": "..." }
}

{
  "method": "Page.loadEventFired",
  "params": { "timestamp": 123456.78 }
}
Domains: the protocol’s building blocks
Domains define related commands, events, types, and experimental capabilities. Common domains include:
| Domain | Typical use | Example |
|---|---|---|
| Page | Navigation, lifecycle, screenshots, PDFs | Page.navigate |
| Runtime | Run JavaScript and inspect execution contexts | Runtime.evaluate |
| DOM | Inspect and mutate the document tree | DOM.getDocument |
| Network | Observe requests, responses, cookies, and loading | Network.enable |
| Debugger | Breakpoints, stepping, scripts, and pause state | Debugger.setBreakpoint |
| Browser | Browser-wide contexts and shutdown | Browser.getVersion |
Each domain must usually be enabled before its events are delivered. For example, call Network.enable before listening for request events, and Page.enable before relying on page lifecycle notifications. Exact parameters and return types are defined by the protocol version exposed by your browser.
Targets, tabs, frames, and workers
A target is the protocol’s unit of attachment. Chrome documents tabs, iframes, and workers as possible targets. A visible tab is not always one target per frame: same-process frames can share a target while an out-of-process iframe can become another target. A beginner-friendly rule is: a target is the thing being debugged, and frames do not always equal targets.
Use the Target domain to list targets and attach to one. After attachment, commands can be sent with a session id so that multiple targets share one browser connection.
GET http://localhost:9222/json/listA response contains fields such as id, type, url, and webSocketDebuggerUrl. The WebSocket URL is the endpoint a raw CDP client uses for JSON messages.
Start Chrome with remote debugging
For local experiments, launch a separate Chrome profile with remote debugging enabled. A separate profile prevents the test instance from locking your normal profile.
google-chrome \
  --remote-debugging-port=9222 \
  --user-data-dir=/tmp/cdp-profile
On macOS, the executable is commonly inside /Applications/Google Chrome.app/Contents/MacOS/Google Chrome. On Windows, use the installed chrome.exe path. Keep the debugging port bound to localhost unless you have deliberately secured the connection; an exposed debugging endpoint can grant powerful control over the browser.
Raw CDP with a WebSocket client
The following Node.js example connects to the first page returned by Chrome, enables the Page domain, navigates, evaluates JavaScript, and captures a PNG. Install the WebSocket package first:
npm install wsconst http = require('node:http');
const WebSocket = require('ws');
function getJson(url) {
return new Promise((resolve, reject) => {
http.get(url, res => {
let data = '';
res.on('data', chunk => data += chunk);
res.on('end', () => resolve(JSON.parse(data)));
}).on('error', reject);
});
}
(async () => {
const targets = await getJson('http://127.0.0.1:9222/json/list');
const page = targets.find(t => t.type === 'page');
if (!page) throw new Error('No page target found');
const ws = new WebSocket(page.webSocketDebuggerUrl);
let nextId = 0;
const pending = new Map();
ws.on('message', raw => {
const message = JSON.parse(raw);
if (message.id && pending.has(message.id)) {
const { resolve, reject } = pending.get(message.id);
pending.delete(message.id);
message.error ? reject(new Error(JSON.stringify(message.error))) : resolve(message.result);
}
});
const send = (method, params = {}) => new Promise((resolve, reject) => {
const id = ++nextId;
pending.set(id, { resolve, reject });
ws.send(JSON.stringify({ id, method, params }));
});
await new Promise(resolve => ws.once('open', resolve));
await send('Page.enable');
await send('Page.navigate', { url: 'https://example.com' });
await new Promise(resolve => setTimeout(resolve, 1500));
const value = await send('Runtime.evaluate', {
expression: 'document.title', returnByValue: true
});
console.log('Title:', value.result.value);
const shot = await send('Page.captureScreenshot', { format: 'png' });
require('node:fs').writeFileSync('example.png', Buffer.from(shot.data, 'base64'));
ws.close();
})();This is intentionally low level. Production clients should handle reconnects, target changes, command timeouts, browser crashes, and events that arrive before a command result.
Calling CDP from Playwright
Playwright provides a higher-level API and can attach to an existing Chromium, Chrome, Edge, Electron, or cloud browser endpoint. Its connection guide documents both channel-based launches and CDP endpoint connections. See Playwright’s CDP connection documentation.
import { chromium } from 'playwright';

const browser = await chromium.connectOverCDP('http://127.0.0.1:9222');
const context = browser.contexts()[0];
const page = context.pages()[0] || await context.newPage();
await page.goto('https://example.com', { waitUntil: 'networkidle' });
console.log(await page.title());
await page.screenshot({ path: 'playwright.png', fullPage: true });
await browser.close();
Choose Playwright when you want locators, auto-waiting, test fixtures, and cross-browser workflow abstractions. Choose raw CDP when you need direct access to a specific domain or command and are prepared to manage protocol details yourself.
Protocol versions and compatibility
The tip-of-tree (“tot”) protocol is the latest definition, but the official documentation says it changes frequently and provides no backwards-compatibility guarantee. Stable protocol 1.3 is a smaller subset associated with Chrome 64 and should be treated as historical version information, not a promise about current Chrome releases. Review the version guidance.
Before using an experimental command, inspect the protocol definition exposed by the target browser. A client connecting successfully does not prove that every command, parameter, event order, or timing behavior is identical across Chromium-derived products. Playwright’s documented endpoint support means it can connect; it is not a complete feature-parity matrix.
| Choice | Strength | Risk or cost |
|---|---|---|
| Tip-of-tree | Newest domains and commands | Methods can change or disappear |
| Stable subset | Smaller compatibility surface | Older and less complete |
| Raw CDP | Maximum protocol control | You own sessions, events, retries, and version handling |
| Playwright over CDP | Convenient automation API | Not every raw CDP feature is wrapped or portable |
Chrome extension access and security
The chrome.debugger extension API is a particular way to connect to CDP. It requires the manifest debugger permission and exposes a restricted set of domains. Chrome also documents enterprise policies that can block attachment. These restrictions apply to that extension API; they are not a universal rule for every CDP client. Read the debugger API reference.
Regardless of client, treat a remote debugging endpoint as privileged. Bind it locally, protect any tunnel, avoid placing credentials in URLs, and close sessions when work is complete.
Common errors and fixes
| Error | Likely cause | Fix |
|---|---|---|
| Connection refused on port 9222 | Chrome was not started with remote debugging, or the port is different | Restart the dedicated profile with the flag and verify /json/version. |
| No page target found | The browser has only workers, extensions, or a blank startup state | Open a page, filter targets by type === 'page', and handle an empty list. |
| Method not found | The browser’s protocol version lacks that command | Inspect the target’s protocol definition or use a supported alternative. |
| Invalid parameters | Parameter names or enum values differ from the target version | Check the domain schema and send only documented fields. |
| Events never arrive | The domain was not enabled, or the listener was attached too late | Enable the domain first and register listeners before navigation. |
| Detached from target | Tab closed, frame moved to another target, or browser crashed | Handle detach events, reacquire the target, and retry only idempotent work. |
| Navigation hangs | The page keeps connections open or waits on blocked resources | Use lifecycle events with a timeout rather than waiting forever for network idle. |
Performance and reliability practices
- Reuse one browser process when safe, but isolate unrelated jobs with browser contexts or separate profiles.
- Set command and navigation timeouts. CDP has asynchronous events, so a missing event must not block a worker forever.
- Subscribe only to domains you need; network and tracing events can be high volume.
- Keep a request id map and reject pending commands when the WebSocket closes.
- Retry browser startup and reconnects with bounded backoff. Do not blindly replay non-idempotent JavaScript.
- Record browser version, protocol version, target id, method, and error payloads for diagnosis.
- For screenshots, wait for the selector, font, image, or application state that actually matters instead of using a large fixed sleep.
Or skip the browser setup
If your goal is dependable website screenshots rather than protocol experimentation, ScreenshotNeo provides one HTTP request to capture a URL as PNG, JPEG, WebP, or PDF. It handles browser setup and adds options such as full-page capture with lazy images, CSS-element capture, device presets, custom CSS and JavaScript, waits, request blocking, headers, cookies, geolocation, caching, signed links, asynchronous jobs, bulk capture, and PDF controls. See the ScreenshotNeo API documentation.
cURL
curl -G "https://api.screenshotneo.com/v1/shot" -d access_key=YOUR_API_KEY --data-urlencode url=https://stripe.com -o shot.webpPython
import requests
r = requests.get("https://api.screenshotneo.com/v1/shot", params={"access_key": "YOUR_API_KEY", "url": "https://stripe.com"}, timeout=90)
open("shot.webp", "wb").write(r.content)
Node.js
const q = new URLSearchParams({ access_key: 'YOUR_API_KEY', url: 'https://stripe.com' });
const res = await fetch(`https://api.screenshotneo.com/v1/shot?${q}`);
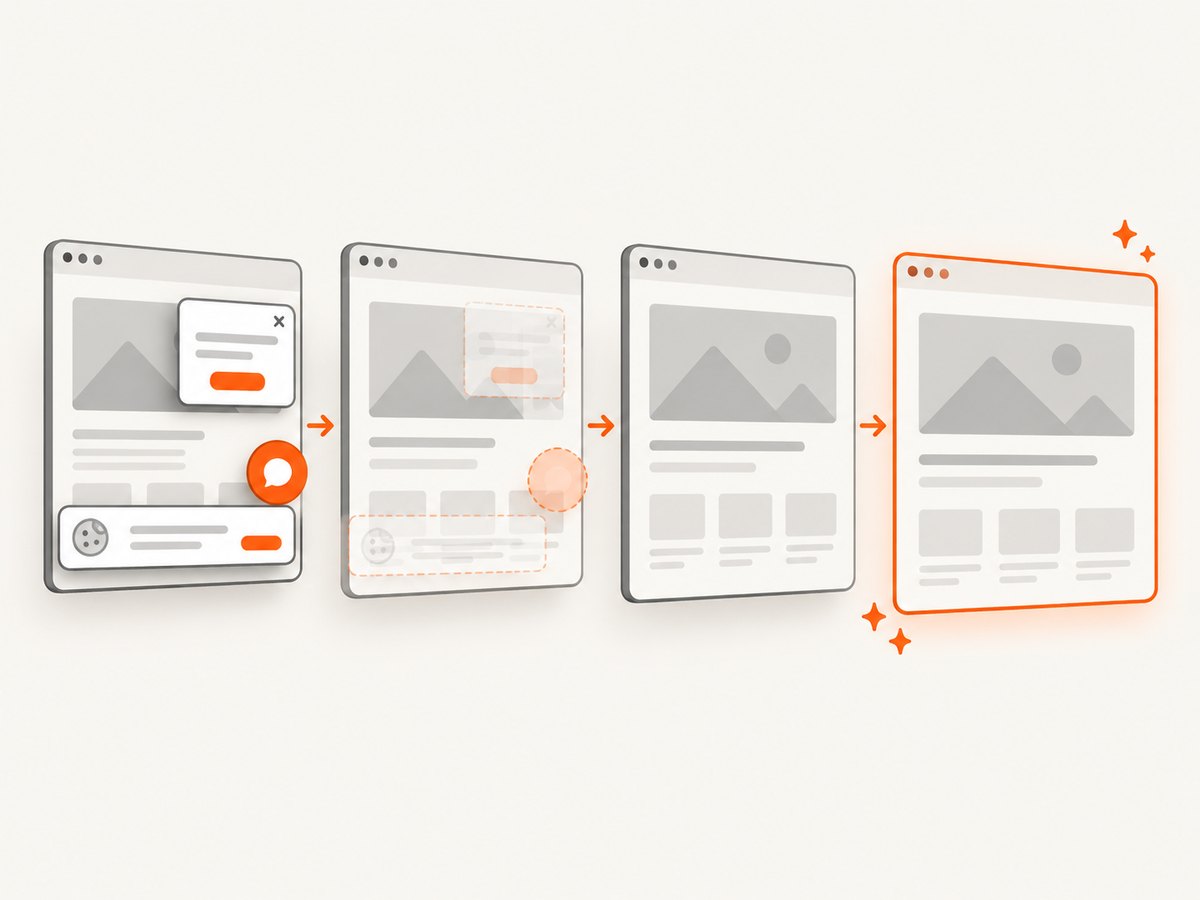
Cookie and consent banners, newsletter popups, and chat widgets are removed before the shot. Bot checks, blank pages, failed loads, timeouts, and cache hits are not billed, and response headers identify the page verdict and billing status. ScreenshotNeo also has an MCP server with take_screenshot, get_page_info, and capture_pdf tools for Claude, Cursor, and other MCP clients. The free plan includes 1,000 screenshots each month with no card; paid plans start at $5 for 3,000. Create a free ScreenshotNeo account.
FAQ
Is CDP the same as Selenium or Playwright?
No. CDP is a browser protocol. Selenium and Playwright are automation tools; Playwright can connect through CDP while adding a higher-level API.
Does CDP work with every browser?
CDP targets Chromium-based and other Blink-based browsers, but command coverage and behavior can differ. Verify the protocol exposed by the browser you operate.
Can CDP control an already open Chrome window?
Only when that browser was started with a reachable remote debugging endpoint, or when an allowed integration such as the extension debugger API attaches to it.
Should a new client target tip-of-tree?
Use it when you need newer capabilities and can track changes. Pin and validate a compatible browser version when stability matters.
When is a screenshot API preferable?
Use one when you need repeatable captures without operating Chrome processes, WebSockets, target sessions, and protocol-version handling yourself.